Guest post by Amney Mounir. Amney is Product Growth at Meta and the founder of Dataford.io. Want to write for Better Sheets too? Here's how guest posts work.
Interview prep is easy to start and hard to keep organized. Within a week you have behavioral stories in one note, SQL practice in another, a list of applications somewhere else, and no clear answer to a simple question: what should I practice today?
I built one Google Sheet to answer that question. It has four tabs: a story bank, a practice log, an application tracker and a dashboard. Everything runs on basic formulas you can read in a minute, so you can change them to fit your own search. You can make your own copy of the template here. The version you open is view only, and the link creates a copy in your own Drive.
Who this is for
I wrote this for one kind of person: someone with a full-time job who is applying to analyst, product or data roles, has ten or more applications open at once, and has a few evenings a week to prepare. Time is limited, so the sheet has two jobs. It tells you what to review today, and it tells you who to follow up with.
Tab 1: Story Bank
Most behavioral questions can be answered with a small set of stories. Start with six to eight. Each row holds one story, with columns for the situation, your action, the result, a main theme chosen from a dropdown, and the questions the story can answer. When you have a number for the result, write it down, since it makes the story easy to follow out loud.
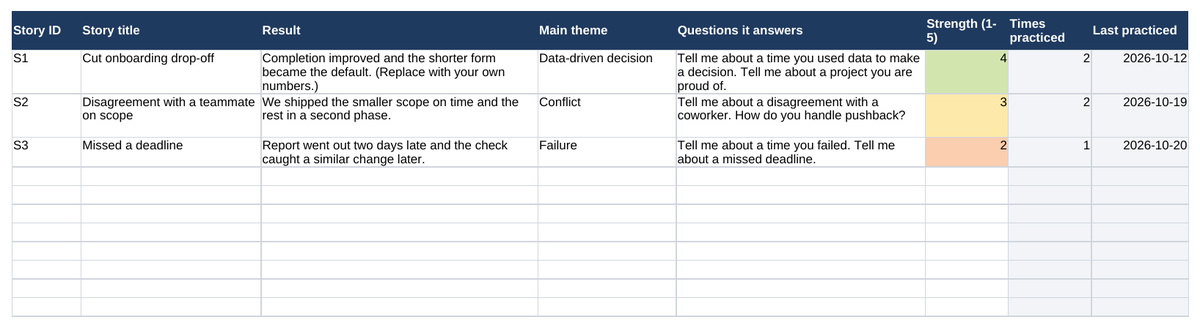
Two columns are calculated. Times practiced counts how often a story ID appears in your practice log:
Story Bank: Times practiced
=COUNTIF('Practice Log'!D2:D200, A2)
Last practiced finds the most recent date for that ID:
Story Bank: Last practiced
=MAXIFS('Practice Log'!A2:A200, 'Practice Log'!D2:D200, A2)
Together they show which stories you keep rehearsing and which ones you forgot. A story with a low strength score and zero sessions is your next practice session. The strength column has a color scale, so weak stories stand out.
Tab 2: Practice Log
One row per session: date, type (behavioral, SQL, case, system design or mock interview), the question or topic, an optional story ID, minutes, and a self-rating from 1 to 5. Be honest with the rating, because the sheet uses it to schedule the next review.
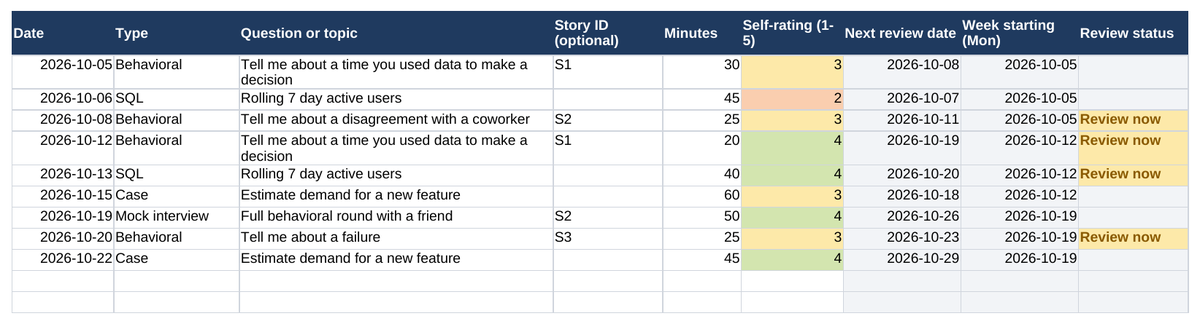
The spaced repetition piece is one formula. A low rating brings the topic back sooner and a high rating pushes it out:
Practice Log: Next review date
=A2+IF(F2<=2, 1, IF(F2=3, 3, IF(F2=4, 7, 14)))
A rating of 1 or 2 means review the next day, 3 means in three days, 4 means in a week, and 5 means in two weeks. These intervals are a simple default, and you can edit the numbers.
The Review status column flags a topic as Review now when its review date has arrived and you have not practiced the same topic since:
Practice Log: Review status
=IF(AND(H2<=TODAY(), COUNTIFS(C$2:C$200, C2, A$2:A$200, ">"&A2)=0), "Review now", "")
The COUNTIFS part looks for a later session with the same topic text, so a topic drops off the list once you practice it again. Keep the topic wording consistent so the match works.
A helper column called Week starting turns each date into the Monday of its week, and the dashboard uses it to group sessions:
Practice Log: Week starting
=A2-WEEKDAY(A2, 2)+1
Tab 3: Application Tracker
One row per company: role, posting link, date applied, stage, last contact, interview date and notes. Stage is a dropdown with Wishlist, Applied, Recruiter screen, Phone screen, Onsite, Offer, Rejected and Withdrawn. Because every stage is spelled the same way, the dashboard counts stay accurate.

The follow-up date defaults to a week after your last contact:
Application Tracker: Follow-up date
=F2+7
The follow-up status compares that date to today and skips stages that are closed:
Application Tracker: Follow-up status
=IF(OR(A2="", F2="", E2="Offer", E2="Rejected", E2="Withdrawn", E2="Wishlist"), "", IF(G2<TODAY(), "Overdue", IF(G2<=TODAY()+2, "Due soon", "On track")))
Conditional formatting colors the stage and the status, so an overdue follow-up shows up in red the moment you open the tab. Change the 7 to whatever cadence suits you.
Tab 4: Dashboard
The dashboard has no inputs. It shows practice sessions, total hours, average self-rating, topics due for review, applications tracked, applications in progress and overdue follow-ups. The stage counts use COUNTIF:
Dashboard: applications per stage
=COUNTIF('Application Tracker'!E2:E200, D5)
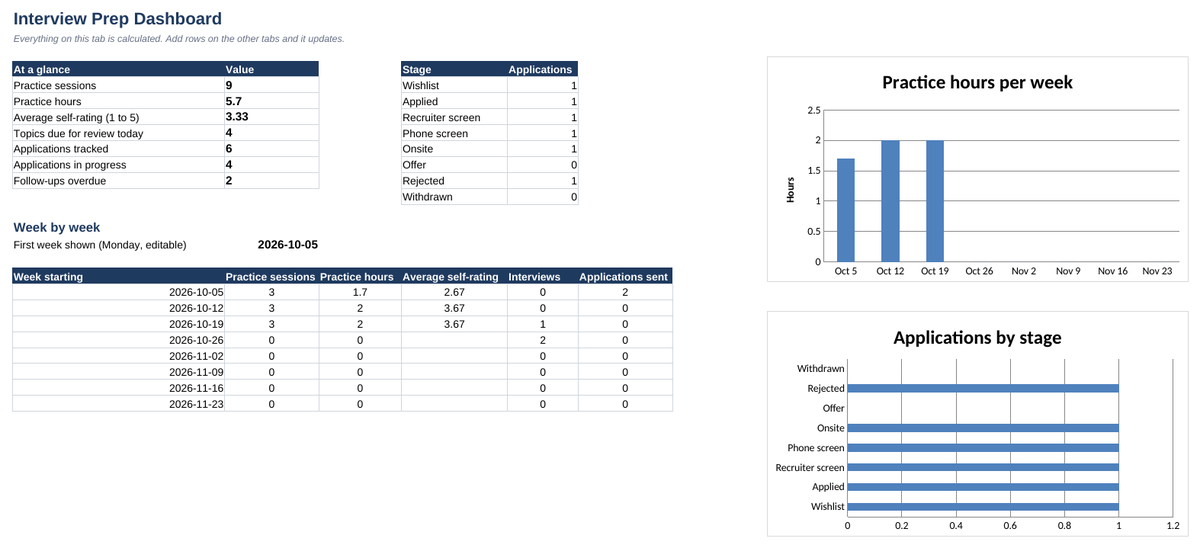
The weekly table covers eight weeks, starting from the Monday of your first practice session. Each row uses the week start date in column A. Practice hours add up the minutes for that week and divide by 60:
Dashboard: practice hours per week
=SUMIFS('Practice Log'!E2:E200, 'Practice Log'!I2:I200, A18)/60
Average self-rating uses the same week filter:
Dashboard: average self-rating per week
=AVERAGEIFS('Practice Log'!F2:F200, 'Practice Log'!I2:I200, A18)
Interviews counts interview dates that fall between that Monday and the following Sunday:
Dashboard: interviews per week
=COUNTIFS('Application Tracker'!I2:I200, ">="&A18, 'Application Tracker'!I2:I200, "<="&A18+6)
The chart of practice hours per week shows whether prep is steady or happens in bursts. It also makes it easy to spot an interview week that had little practice in the weeks before it.
A weekly routine that fits the sheet
This takes about ten minutes, a few times a week.
- Open the Dashboard and check the topics due for review and the overdue follow-ups.
- Practice the due topics first, then add a new topic if you have time left.
- Log each session right after you finish, with an honest rating.
- Update stages and last contact dates after any email or call.
- Once a week, read the weekly table and decide where next week's hours should go.
Where to find questions to log
The log works best when the questions come from somewhere. If you need a place to find them, Dataford has a free bank of interview questions by role. Pick a few you want to drill and paste them into the topic column of the Practice Log.
Make it yours
The easiest changes are the review intervals, the follow-up cadence and the list of question types. You can also add columns for salary range, referral contact or recruiter name. The formulas are filled down to row 200, so if you need more rows, copy the last row of formulas further down. The example rows (Northwind, Fabrikam and the others) are made up, so delete them before you start and add your first three stories.
About the author

Amney Mounir
Amney Mounir is Product Growth at Meta, founder of Dataford.io (scaled from 0 to 50k users), and has 85k+ LinkedIn followers.
This is a guest post. Read about guest posts on Better Sheets.
