


Spreadsheet History
The people and engineering calls that built the modern spreadsheet. Why are columns letters? Why does a fighter pilot show up in the origin story? Decades-old quirks still shape every cell you edit.
Pre-1960s
Ancient Accounting
Ledgers, clay tablets, and the story we tell ourselves about the grid
You might picture ancient accountants hunched over enormous sheets of paper: rows and columns, pencil moving, numbers changing, erasing, starting again. Grinding work. Excel in parchment, or so the story goes.
That picture is wrong.
Serious accounting did not work that way. It ran on ledgers: bound books of transactions recorded in order. A sale goes in. A payment goes in. A correction does not overwrite the original line. You post an amendment, clearly labeled, that explains what changed and why. The history stays visible. Debits and credits balance. The past is not edited away.
Before computers, before the spreadsheet
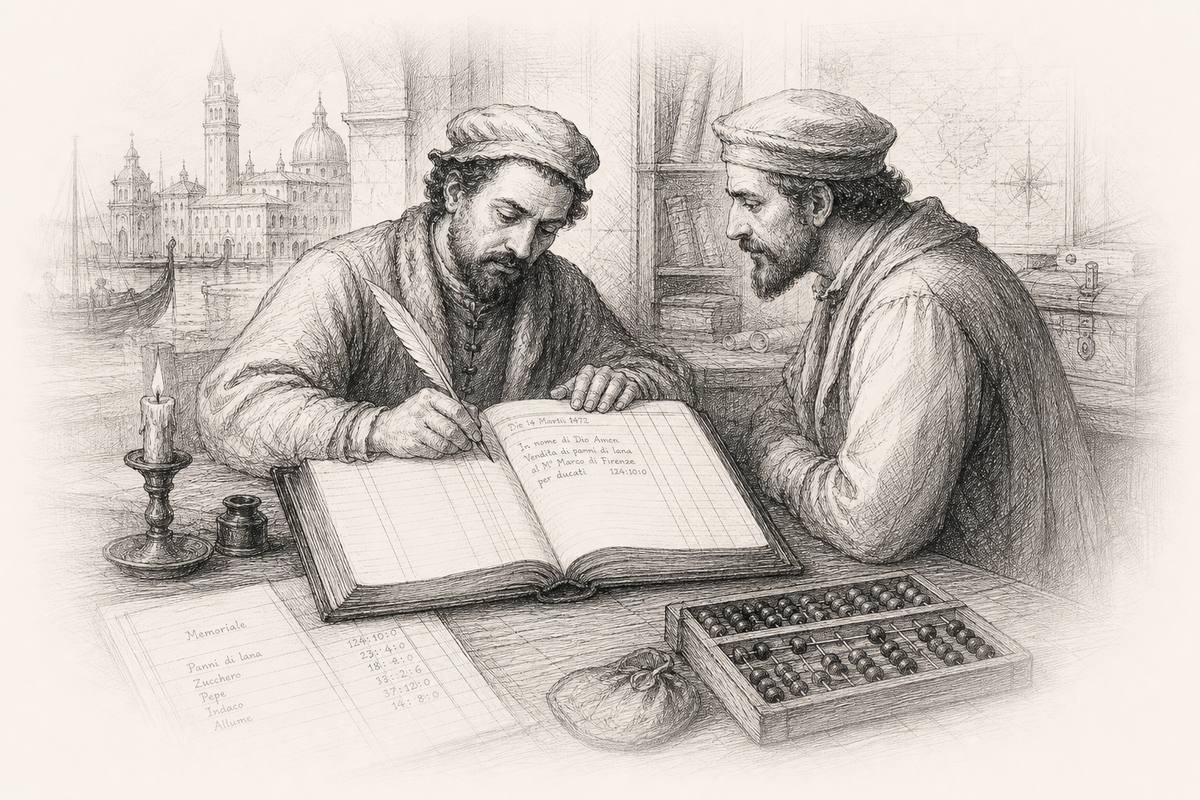
Humans still organized numbers in rows and columns for thousands of years. Mesopotamian clay tablets. Roman abacuses. Medieval merchants' daybooks. Venetian double-entry bookkeeping from the 1400s. Wide ruled paper in the 1800s. The grid is old. The habit of rewriting the grid is not.
Ledgers answered a different question: "What happened, in order, and can we prove it?" Forecasting and scenario planning came later, on different paper, for different jobs.
The software rewrote the past
VisiCalc made the editable grid feel inevitable. Dan Bricklin said the killer use case was forecasting: enter a number, watch dependents update, change your mind, try again. That is scenario planning, not bookkeeping. We read today's spreadsheet back into yesterday's accountants because the software won. Immutability is the opposite of what spreadsheets became.[2][4]
Earliest mentions of the word spreadsheet
For most of the 20th century, people wrote spread sheet as two words: a physical sheet of paper, often wide, laid out in rows and columns. Printers used spread for facing pages in a magazine. A spread sheet was paper wide enough to hold a full layout at once. Accountants borrowed the phrase for analysis tables: costs spread across columns, totals visible in one glance.
Later the words merged. Spreadsheet (one word) shows up in professional dictionaries by the 1950s as settled vocabulary. By the 1960s it picked up a second meaning: software that mimicked the paper form. Same lineage, different era. The hyphen and the space came first. The compound came after. VisiCalc did not invent the word. It inherited it.[6][15]
Linear math, written down
Before calculators, clerks used comptometers and adding machines. Before those, columns of figures on paper with a stubby pencil. The grid let you lay out numbers and follow the math with your finger instead of holding it all in your head. That was layout and arithmetic, not live recalculation across linked cells.
What changed in the 20th century was not the concept of tabular data. It was automatic recalculation: change one cell, and every dependent cell updates. That required computers. In the 1960s, those cost more than a house.
1960s
Early Signs of Life
Large machines, hundreds of thousands of dollars, and the first computerized grids
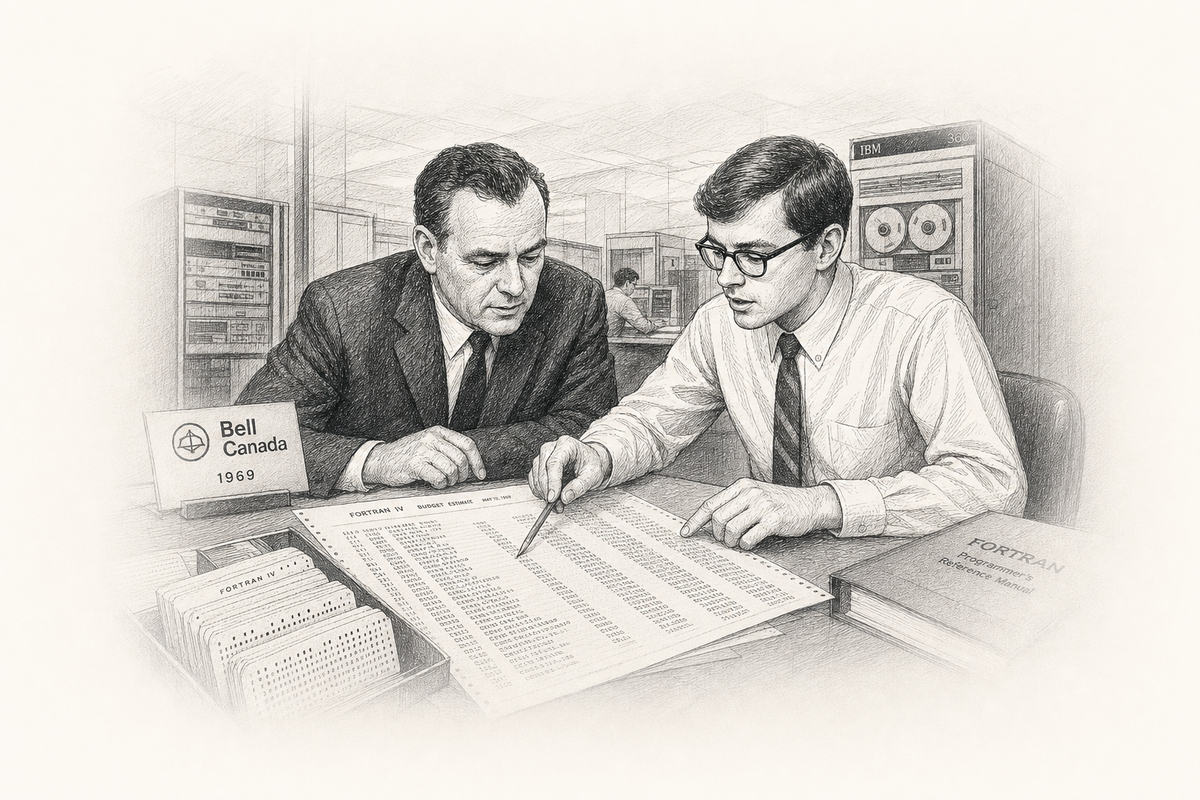
In the 1960s, computers filled rooms, and the people who programmed them rarely touched the machines. Fortran analysts fed punch cards to mainframes at universities, defense contractors, and phone companies. Most had never seen a mouse; Douglas Engelbart's demo was still a few years away. When Bell Canada needed a budget form changed, those analysts were who managers called first.
Professor Richard Mattessich at the University of British Columbia pioneered computerized spreadsheets for business accounting between 1961 and 1964, culminating in Simulation of the Firm Through a Budget Computer Program. He was not building a toy. He was simulating an entire firm's budget on a mainframe.[5][12]
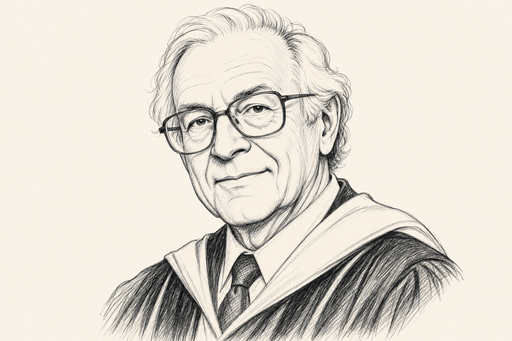
Pioneered computerized budget simulation on mainframes. His work predates VisiCalc by nearly two decades and proves the idea was academically alive long before the personal computer existed.
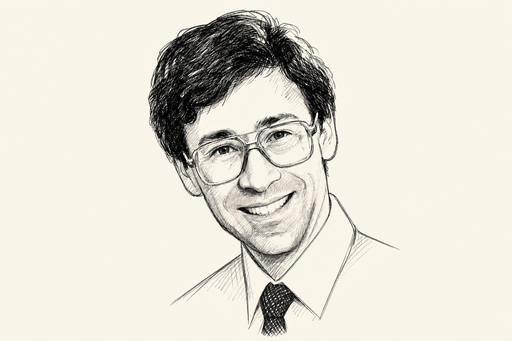
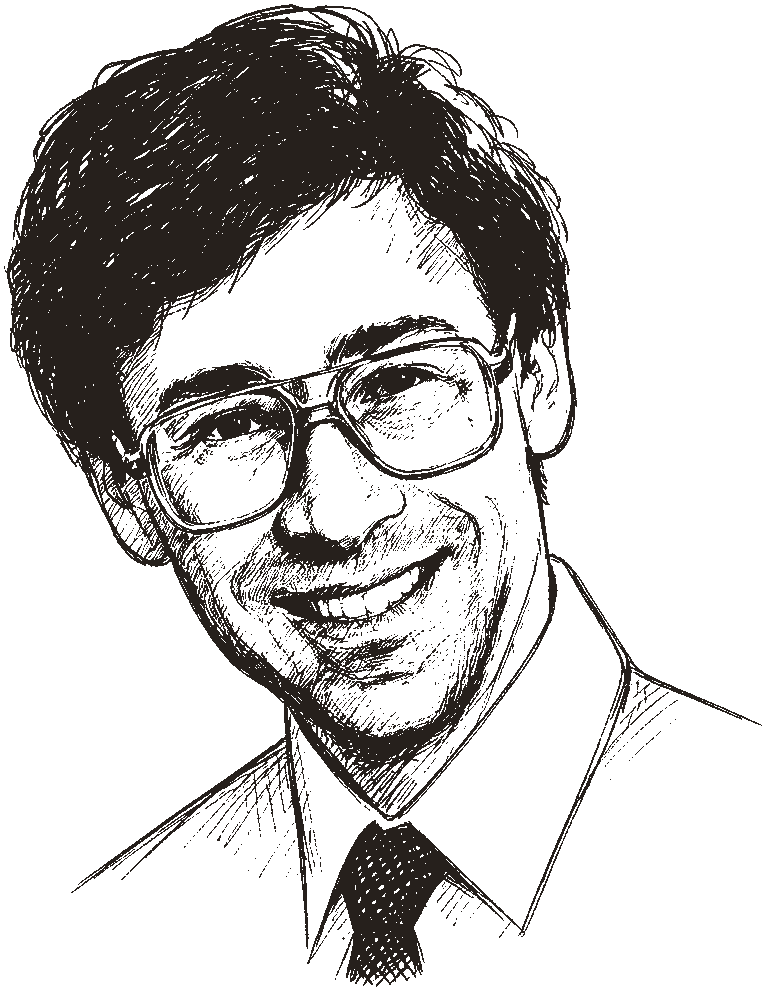
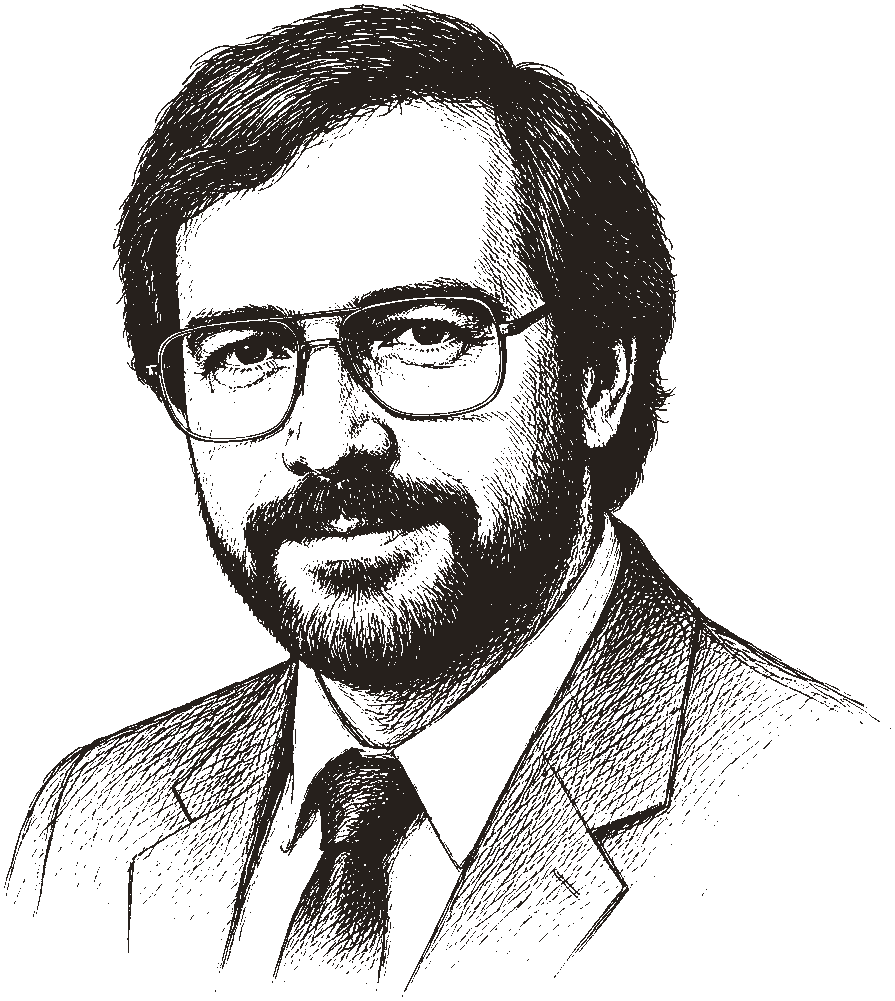
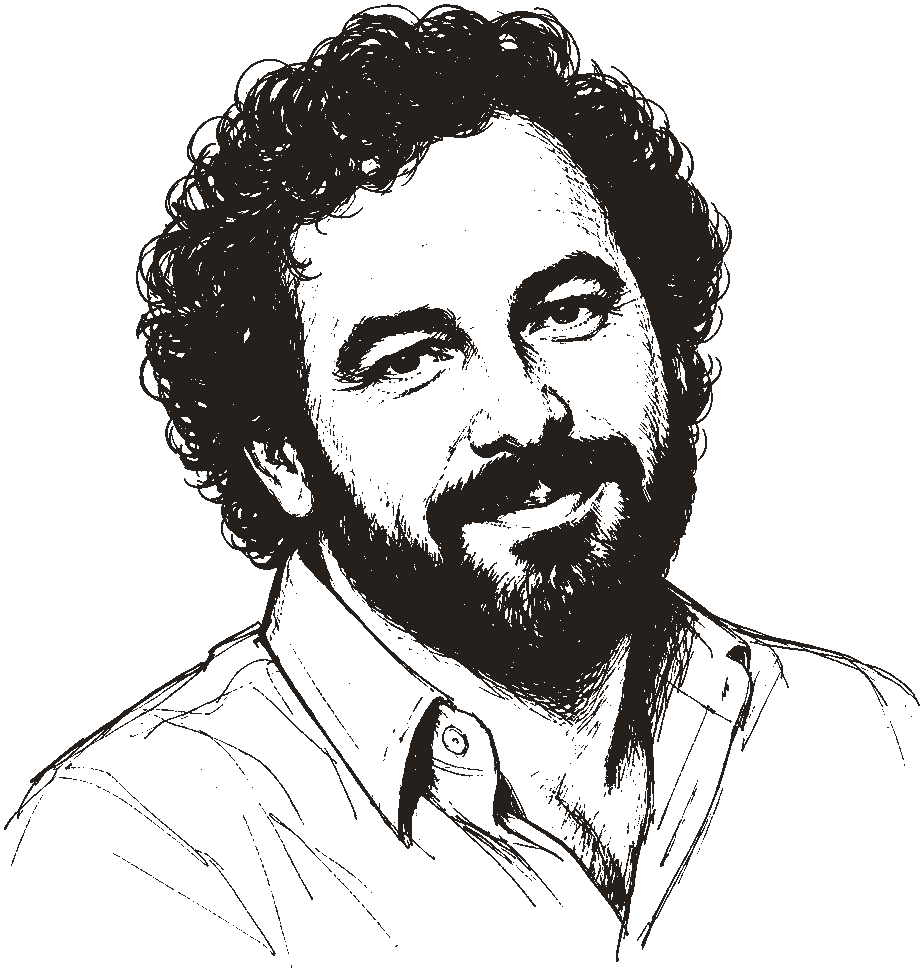
Met Landau at McGill in the mid-1960s. Co-founded LANPAR Technologies and co-invented LANguage for Programming Arrays at Random. Pitched eighteen U.S. telephone-company vice presidents in 1971. Later pursued a Master's of Education at Harvard and helped build early educational multimedia.
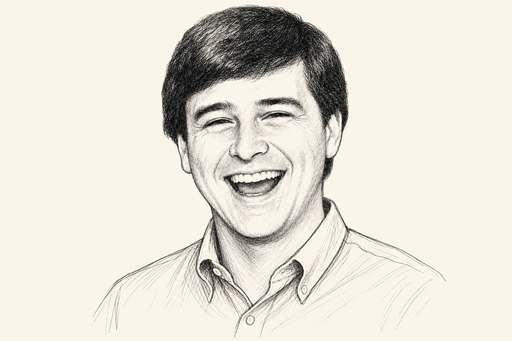
Co-invented LANPAR with Pardo after a dog-walk conversation that became a programming language. Recognized the forward-referencing breakthrough on the spot. Won U.S. Patent 4,398,249 with Pardo in 1983 after twelve years of litigation.
In the summer of 1969, AT&T changed roughly 2,000 cells in the budgeting forms Bell Canada depended on. When the plant manager asked how long reprogramming would take, internal MIS groups quoted two years. Pardo and Landau had another idea: let the manager type the form the way he would write it on paper, separating cells with semicolons, and let the computer resolve the dependencies.[14][21]
Why can't we simply let the Bell Canada manager type the forms as he normally would write them, simply putting semicolons between each cell?Rene Pardo, recalling a conversation with Remy Landau, summer 1969[21]
Landau looked at him and said, "You know what you just said? You just invented a computer language." They formed LANPAR Technologies that year. The name was a mash-up of their surnames and an acronym: LANguage for Programming Arrays at Random. They rented a hotel room and wrote the first compiler over six weeks, often working from eight in the morning until two at night.[21]
Their breakthrough was forward referencing: formulas could point at cells not yet evaluated, so users did not have to think about execution order. Drop your punch cards, shuffle them, rerun the job. The grid still recalculated correctly. Today we call that reactive programming. In 1983 it became a patent.[14][21]
LANPAR was the grid language; OUTCOM was the upper command layer for generating reports. Cells could branch on conditions and reach external databases. The team licensed the software rather than selling source outright: they copyrighted the code and kept ownership. In 1971, Pardo pitched eighteen vice presidents of every U.S. telephone company. AT&T's rule was unanimous consent. They got it. The deal licensed what the inventors' families later called the world's first spreadsheet, a decade before VisiCalc.[14][21]
LANPAR ran on mainframes. It was not interactive in the VisiCalc sense: you submitted jobs, waited, read printouts. But it was a programming language for two-dimensional arrays with formulas, the conceptual ancestor of every cell reference today.[14]
What survives from 1969
Original LANPAR material still exists: flow charts, FORTRAN source, punch tape, and a manual that was literally the one-hour presentation taught to those eighteen AT&T vice presidents. Pardo and Landau had also collaborated earlier on the world's first international computer art exhibit for Canada's National Film Board.[21]
The 1960s also set an expectation that stuck: computers should deliver answers. Management wanted one tool for everything. Spreadsheets became that tool mostly because they were flexible, not because they were perfect for every job.
1960s
The Market Commercializes
Go to the moon, price the impossible, forecast what has never been sold
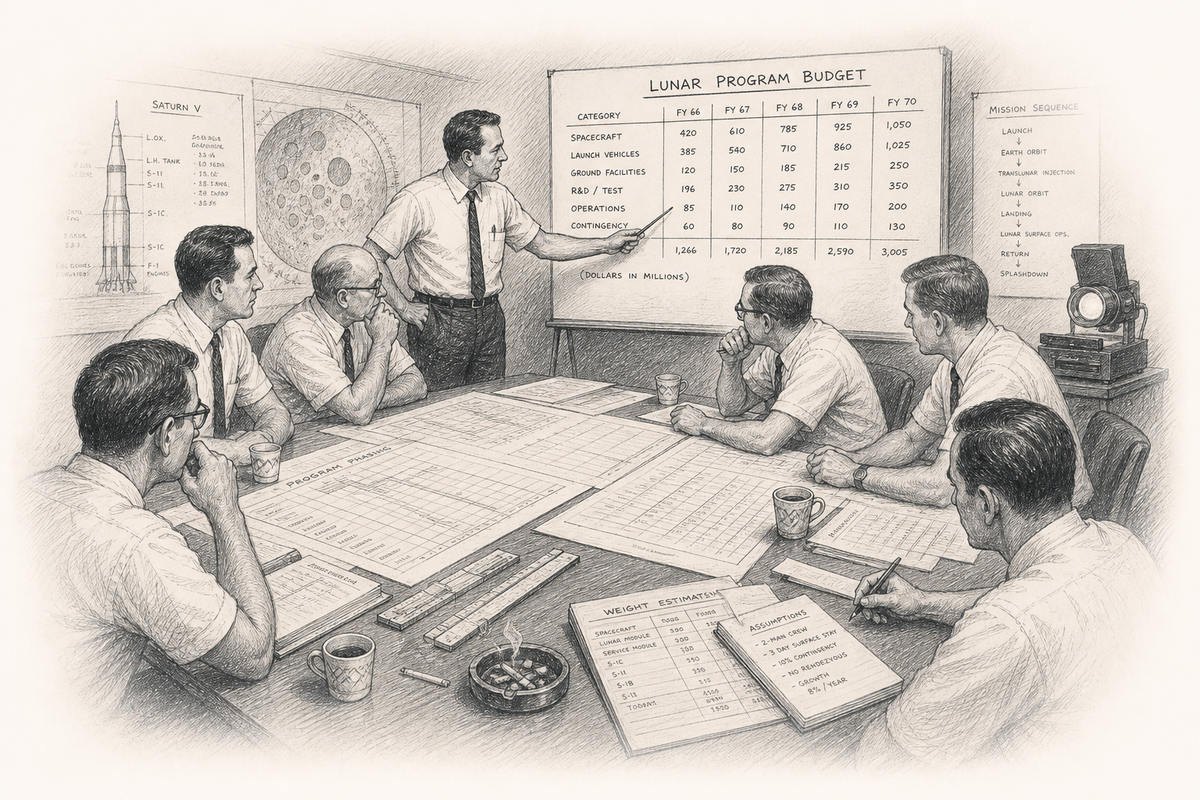
The business problem of the 1960s was not bookkeeping. Ledgers worked fine. The hard part was forecasting. How do you price a product that has never existed? How do you budget a lunar program? How do you model a market that has no precedent?
Defense contractors, aerospace firms, and telcos needed scenario tools. Not immutable accounting records, but living models where assumptions could be swapped and outcomes compared. LANPAR at Bell Canada and GM was exactly this: budgeting at scale, across divisions, with arrays that could be reprogrammed. When AT&T rewrote 2,000 budget cells, Bell Canada's MIS group quoted two years. With LANPAR, the plant manager could do it himself over a weekend, without waiting on Fortran programmers.[14][21]
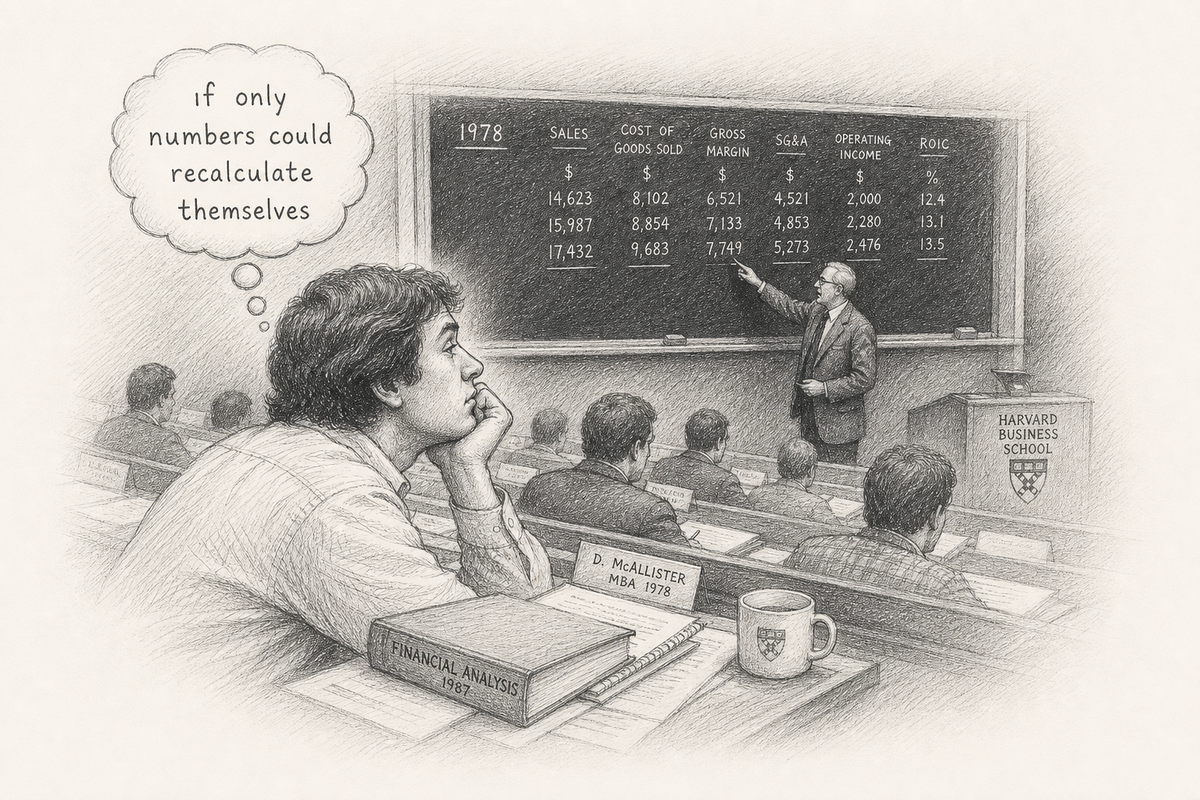
Dan Bricklin would later sit in a Harvard Business School classroom and hit the same wall: case studies required rebuilding entire financial models by hand every time a single assumption changed. Businesses already lived on forecasts. The tools were just slow.
1970s
Spreadsheets Get Personal
The Apple II, a boring finance class, and the birth of the modern grid
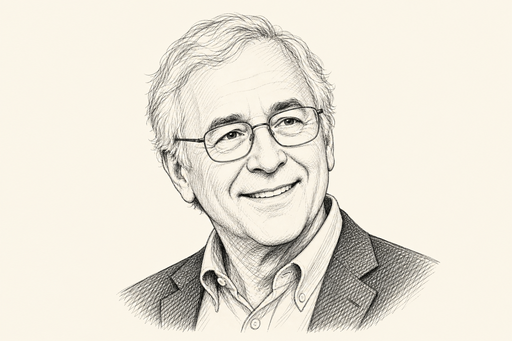
In the spring of 1978, Dan Bricklin, a Harvard MBA student and MIT electrical engineering graduate, had a daydream: what if his calculator had a ball on its back, like a mouse? What if he could see a virtual spreadsheet hanging in the air like a fighter pilot's heads-up display, circle numbers, and answer "10% will be fine"? Not bookkeeping. Forecasting, with the immediacy of a cockpit HUD.[2]
He prototyped a five-column, twenty-row matrix in Apple Integer BASIC over a weekend on a borrowed Apple II. It could not scroll. It could not do much arithmetic. But you could see the grid form as you typed. The metaphor was "an electronic blackboard and electronic chalk in a classroom."
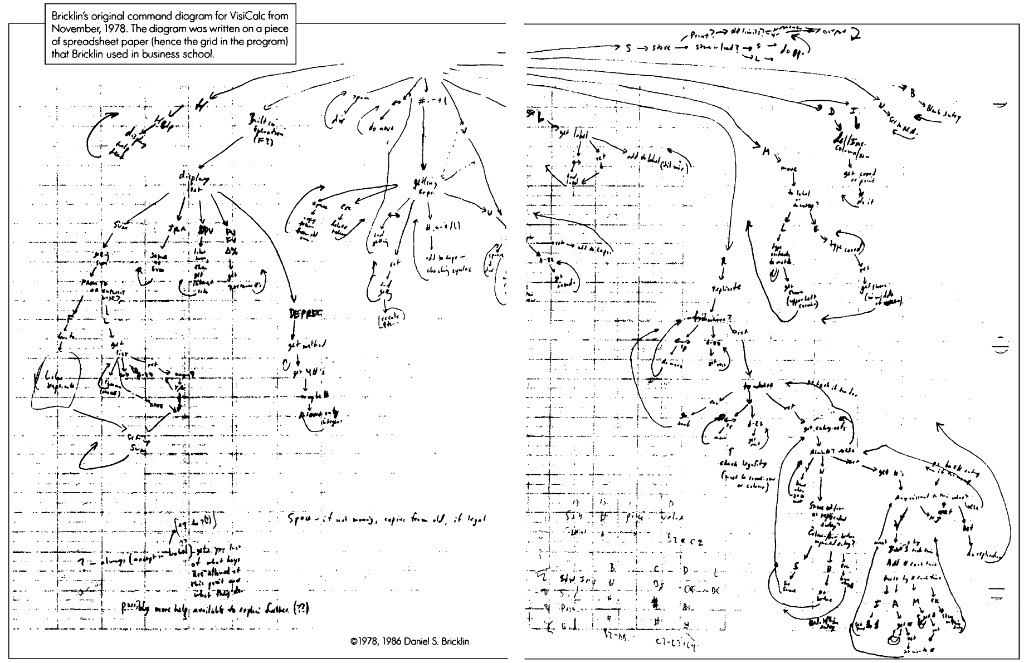
Before production code, Bricklin mapped the whole program as a state diagram: what each keystroke did, how replicate worked, where help appeared. In November 1978 he sketched it on the back of Harvard Business School spreadsheet paper. The blue grid lines show through in the scan. Paper became prototype. The software inherited its grid because the design was literally drawn on one.[22]
Instead of thinking about paper printouts and punch cards, I imagined a magic blackboard that if you erased one number and wrote a new thing in, all of the other numbers would automatically change, like word processing with numbers.Dan Bricklin, TEDxBeaconStreet[4]

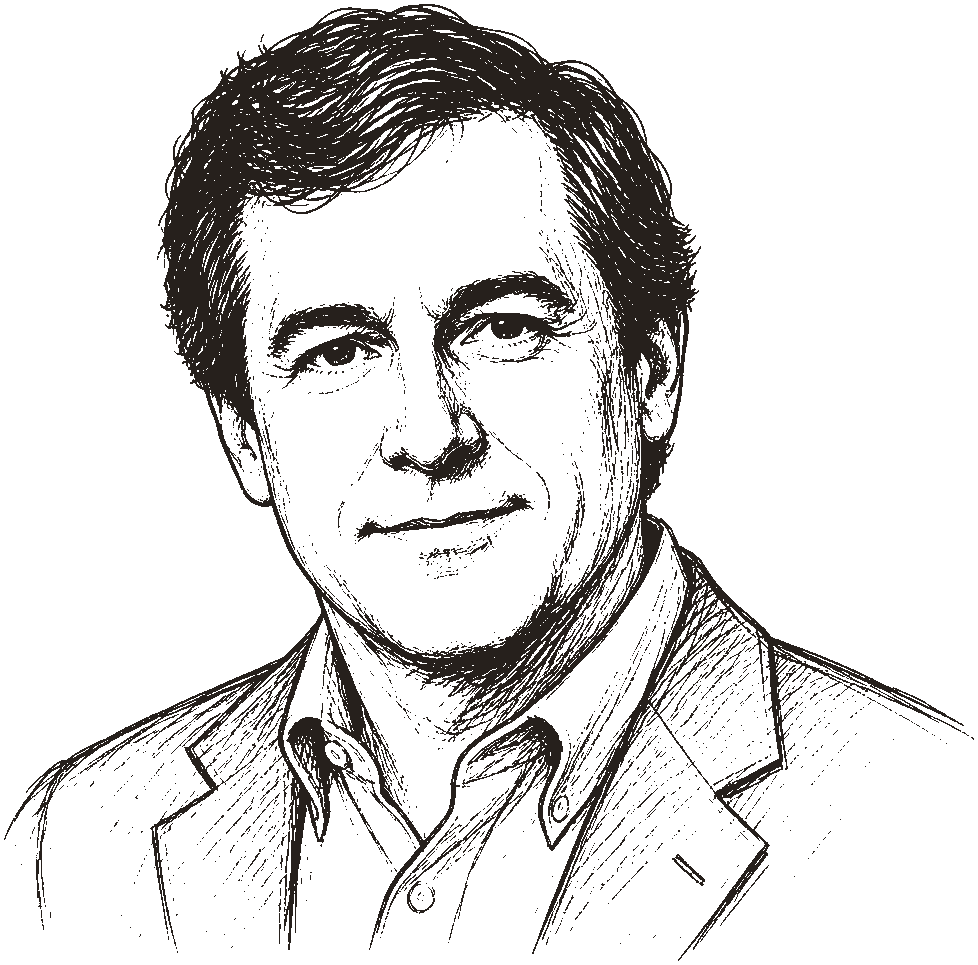
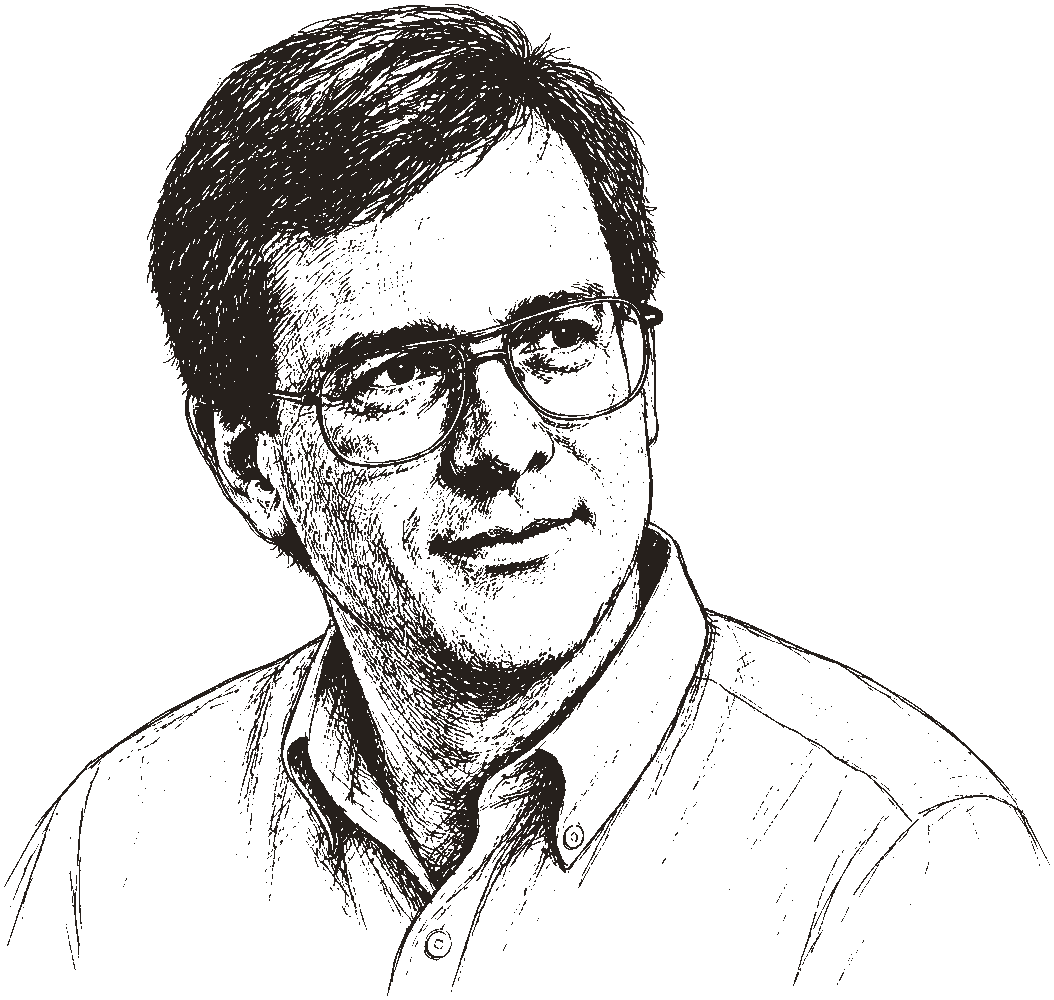
Conceived the visible calculator. Wrote the first prototype. Chose the name VisiCalc (visible calculator) over Calcu-ledger and Calcu-paper. Called Bob Frankston the "co-creator" who made it real.
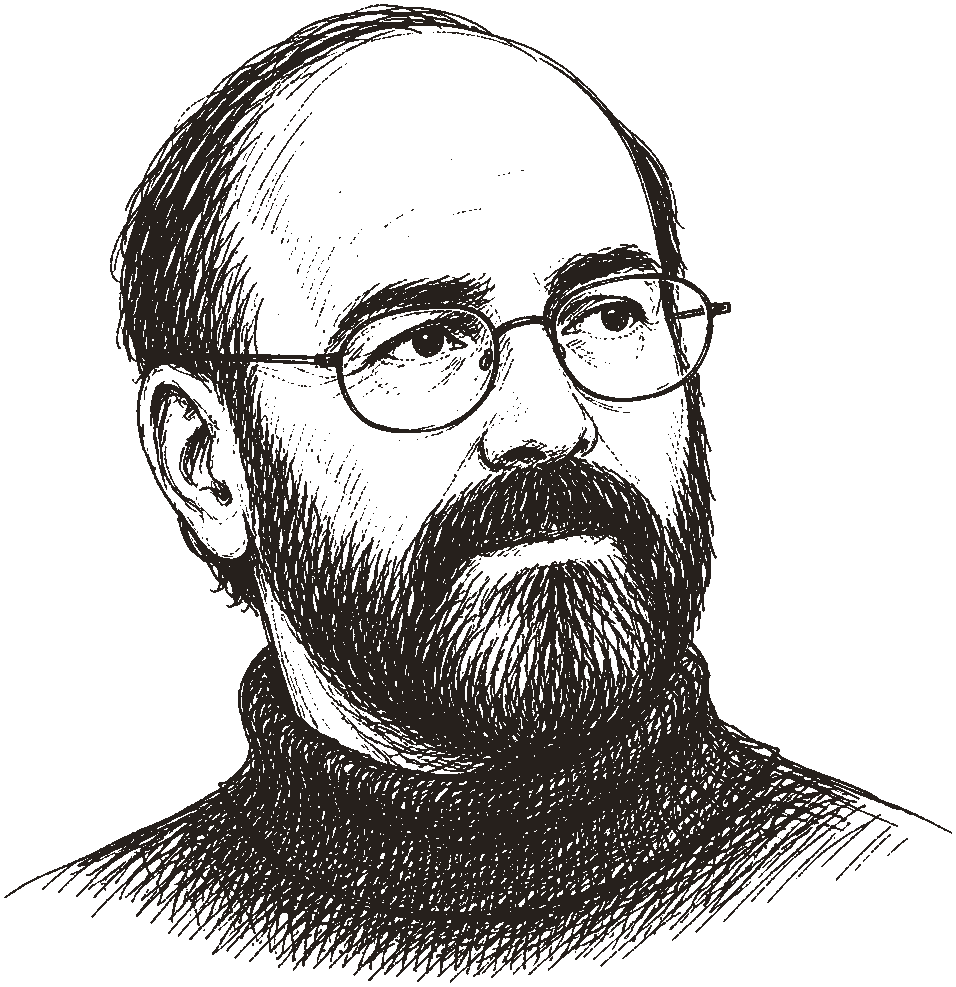
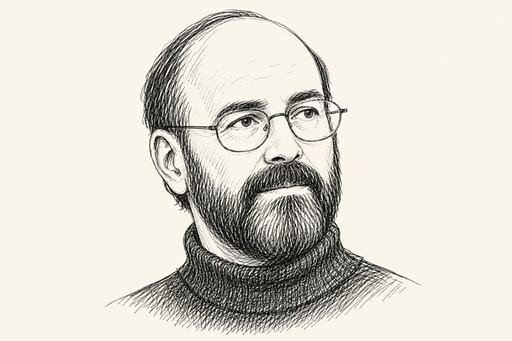
Rewrote VisiCalc in 6502 assembler on a Multics timesharing system. Packed the entire program into roughly 20KB of memory. Added scrolling, faster arithmetic, and the production polish that made a demo into a product. In a 1984 BYTE interview, he recalled the naming hunt: "electronic ledger, electronic blackboard, visible calculator. That's what we finally based the name, VisiCalc, on."[1]
Byte Magazine associate editor who insisted VisiCalc run on the Apple II. Founded Personal Software (later VisiCorp). Ran the teaser ad in Byte that launched an industry.
Bricklin and Frankston formed Software Arts Corporation on January 2, 1979. In May, Fylstra's Personal Software began marketing VisiCalc. It shipped in November 1979 for under $100. Within years, roughly one million copies sold. Dealers bundled Apple II machines with VisiCalc because businesses bought the computer to run the spreadsheet.[14][20]
The command tree on paper became a print ad. Fylstra had to teach the grid to buyers who had never seen one.
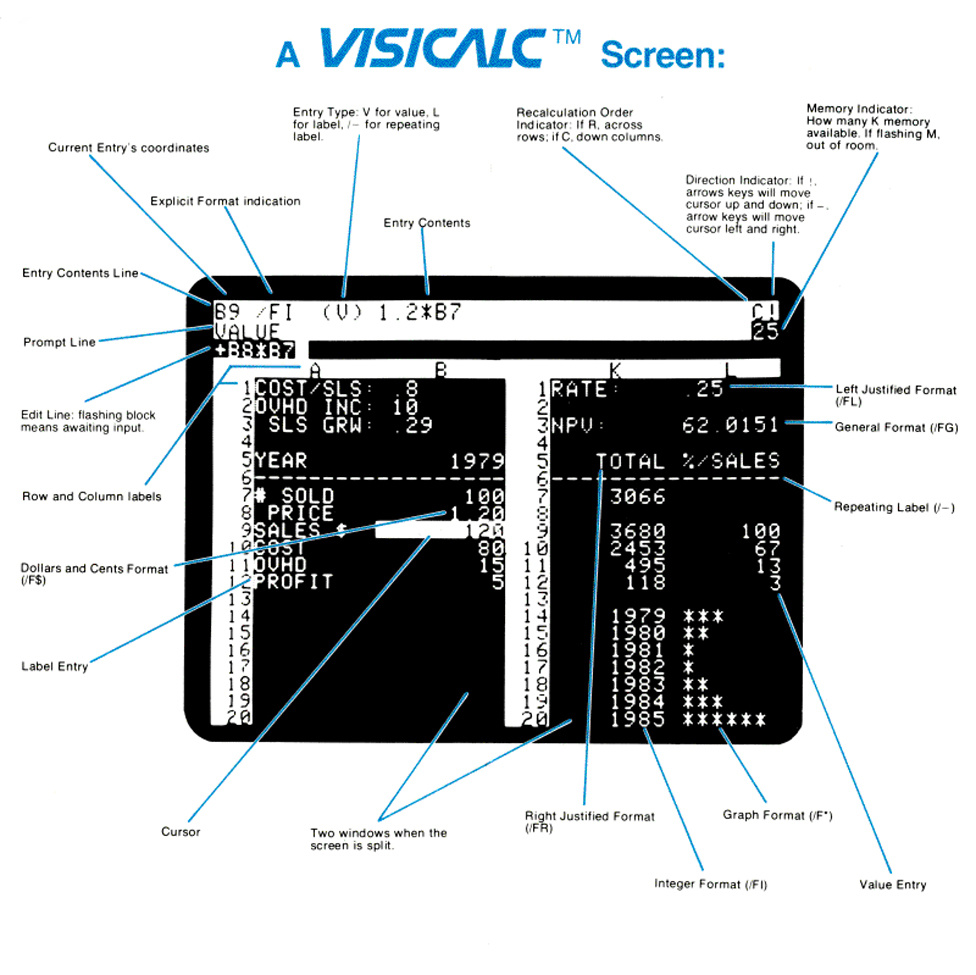
/FI and /F$, and a split window for side-by-side views.[23]Dan Fylstra walked into my office at Apple one day and pulled out a disk from his vest pocket and said, "I have this incredible new program. I call it a visual calculator." It became VisiCalc. That's what really propelled the Apple II to the success it achieved more than any other single event.Steve Jobs, 1990 interview, The Machine That Changed the World[3][13]
Credited VisiCalc as the event that propelled the Apple II into offices. Later argued the same pattern held for Lotus 1-2-3 and the IBM PC: killer spreadsheets sold the hardware.
The Apple II was not the first personal computer. But Jobs credited VisiCalc as the reason it succeeded in offices. If VisiCalc had shipped on another machine first, he said later, "you'd be interviewing somebody else right now."[3] By 1985, the Wall Street Journal was running editorials that assumed readers already knew what VisiCalc was. Accountants divided their careers into before and after the computerized spreadsheet. A twenty-hour weekly bookkeeping task could collapse to minutes.[14]
Bricklin and Frankston squeezed VisiCalc into 20KB of 6502 assembler. I rebuilt it in Google Sheets: green-on-black cells, slash commands, live recalc. No Apple II required.
Better Sheets · 2026
VisiCalc in Google Sheets
A working recreation you can open in your browser. Same visible-calculator idea, built with formulas and formatting.
Why VisiCalc needed the 32KB Apple II
Frankston could not fit the program in 16KB. The low-end Apple II was too small. VisiCalc required the pricier 32KB model. That higher price also made the bundle look serious: businesses were buying a financial tool, not a hobby computer.
Early input used the Apple paddle (a dial) before switching to arrow keys and spacebar. The mouse dream waited for another decade.
First prototype
Five columns, twenty rows, Integer BASIC on Apple II.
Software Arts founded
Bricklin and Frankston incorporate.
Byte teaser ad
Personal Software announces VisiCalc.
VisiCalc ships
First killer app for personal computers. Columns as letters, rows as numbers. A1 notation from day one. October 17 is now International Spreadsheet Day.
That letter-and-number split answers a question most users never think to ask. Column A, row 1 is A1. If both axes used numbers, 11 could mean row eleven or row one, column one. On a tiny screen, letters disambiguate at a glance. Microsoft's Multiplan later bet on R1C1 instead; A1 won because people read it faster.[14]
1980s
Modern Spreadsheets Rise
Graphical interfaces arrive. Lotus leads. Microsoft follows with a mouse.
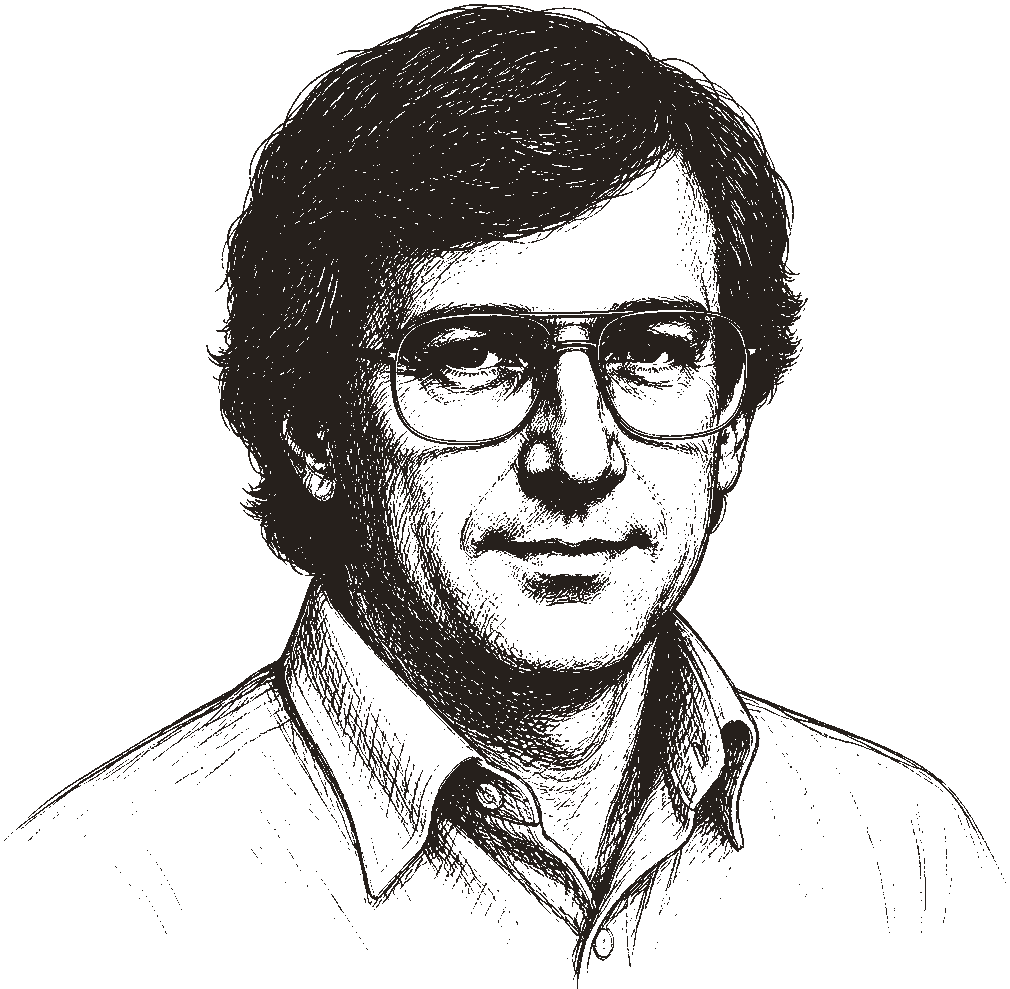
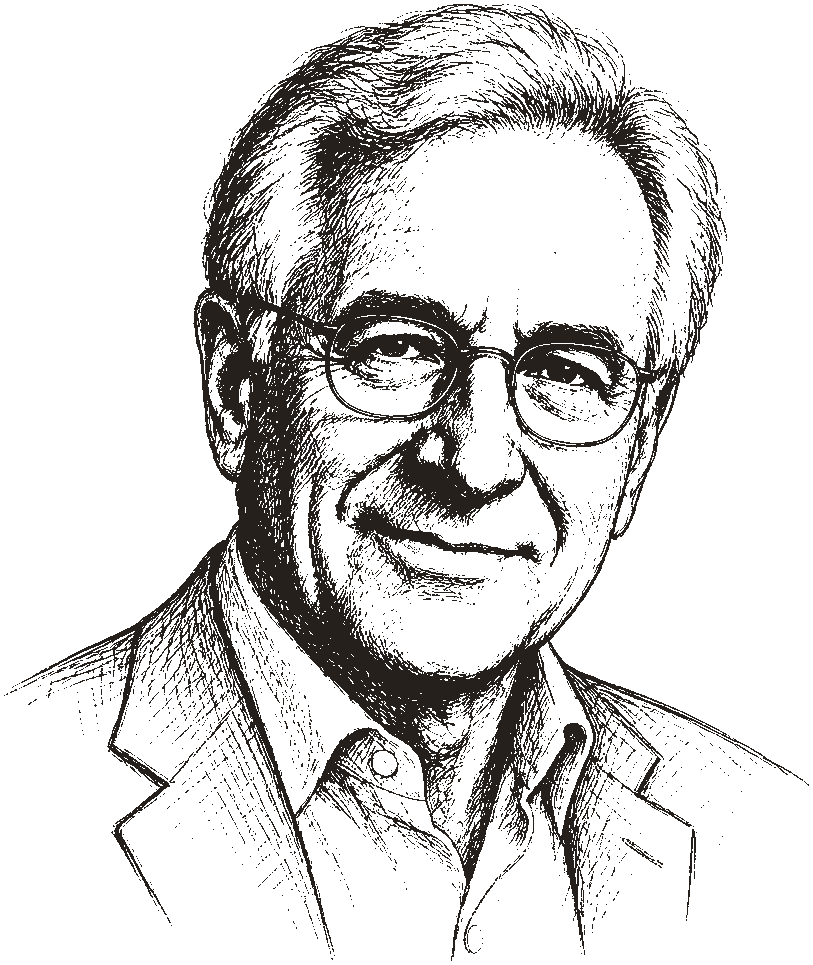
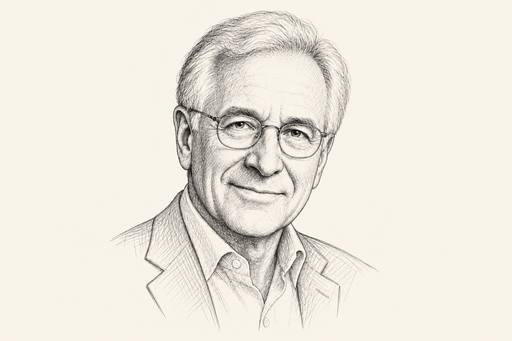
While VisiCalc's creators fought legal battles with VisiCorp (beginning September 1983), the IBM PC arrived and the spreadsheet market grew fast. Mitch Kapor, former VisiCalc product manager at Personal Software, had already sold VisiPlot and VisiTrend back to VisiCorp for $1 million. With Jonathan Sachs and venture capitalist Ben Rosen, he founded Lotus Development Corporation in 1982.[10][18]
Kapor walked an early Lotus prototype into VisiCorp, the company he'd just left, and offered to sell it back. Executives looked at what Sachs had built and said the functionality was "too limited." Kapor kept it. When 1-2-3 launched in 1983, he and Sachs owned the new standard almost overnight.
Former VisiCalc product manager. Built 1-2-3 to feel familiar to VisiCalc users while exploiting the IBM PC's memory and speed. Lotus revenue hit $53M in year one, $156M in year two.
Co-architect of Lotus 1-2-3. Built it with Kapor for the IBM PC.
Venture capitalist who financed Lotus Development in 1982 and sat on its board. Also backed Compaq, Electronic Arts, and Silicon Graphics through Sevin Rosen Funds.

Excel 1.0 for Macintosh (1985) brought pull-down menus and mouse-driven GUIs to spreadsheets. Many bought Macs specifically for Excel. Excel 2.0 for Windows arrived October 31, 1987.
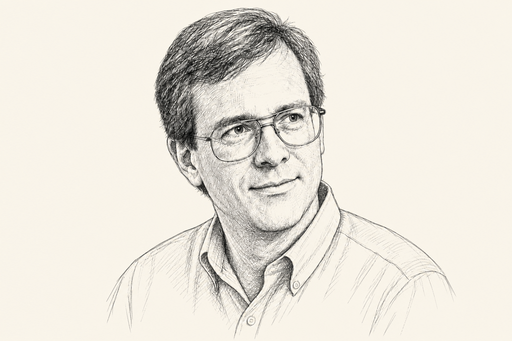
Lead developer on Multiplan and Excel 1.0. Invented "intelligent recalc" so only dependent cells updated, a speed edge over Lotus 1-2-3. The team's motto: "Recalc or Die."
Founded Sorcim in 1980 and shipped SuperCalc for the Osborne 1 portable. Bundled with WordStar, it gave CP/M users a VisiCalc-class grid before the IBM PC dominated.
Kapor and Sachs packed three tools into one product: spreadsheet, graphics, database. They named it 1-2-3. Sachs engineered named cells, cell ranges, and macros so VisiCalc veterans could level up without relearning the grid. Kapor's pitch was familiarity with a faster machine underneath.
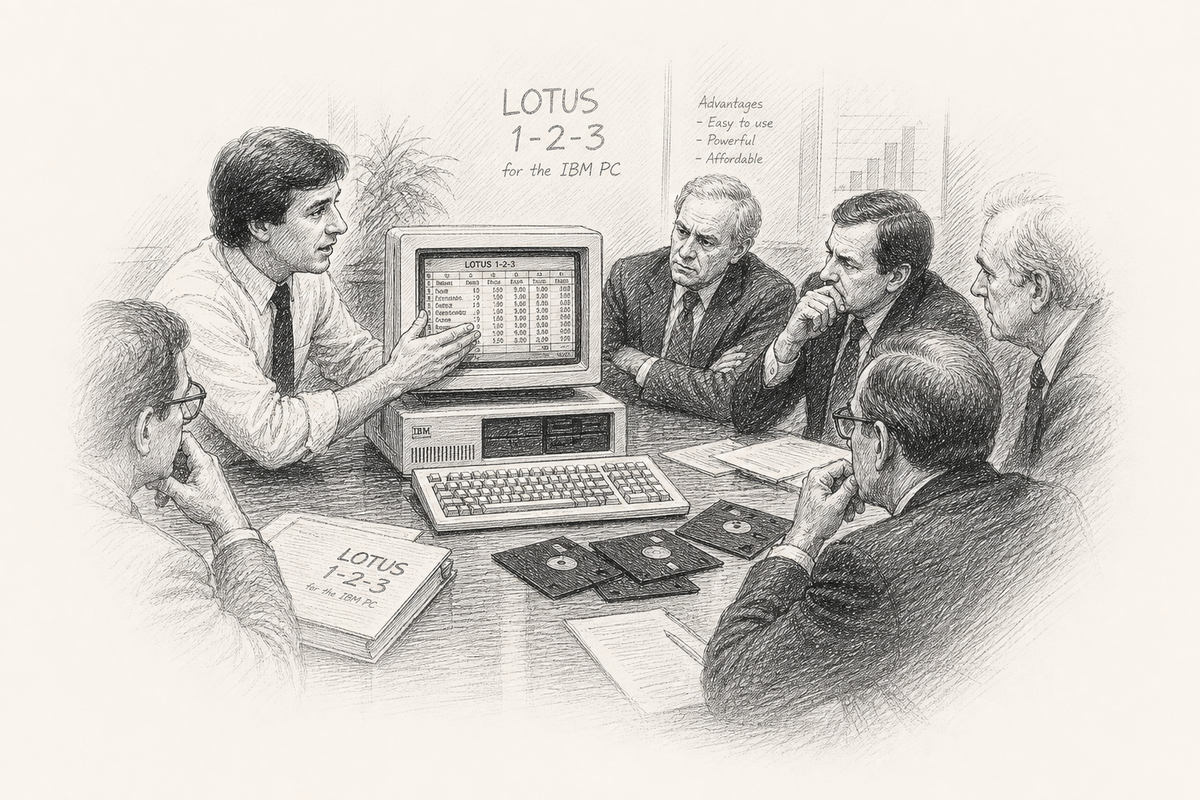
It was a product that really legitimised the PC worldwide as a general business tool for non-technical users more than any other product. People were buying PCs to learn 1-2-3.Mitch Kapor, 30th anniversary interview, The Register, 2013[16]
Steve Jobs made the same argument about platform shifts: VisiCalc sold Apple IIs; Lotus 1-2-3 sold IBM PCs. Two spreadsheets, two industry explosions.[13]
| Product | Publisher | Price (era) | Notes |
|---|---|---|---|
| Lotus 1-2-3 | Lotus | Market leader | Named cells, macros, charts |
| Excel | Microsoft | $495 (Mac) | GUI, mouse, pull-down menus |
| Multiplan | Microsoft | $195-$250 | R1C1 notation, cross-platform |
| Framework | Ashton-Tate | $695 | Integrated suite |
| Easy Planner | Computer Associates | $195 | PC contender |
| PFS Plan | Software Publishing | $140 | Consumer-friendly |
| PlannerCalc | IBM | $80 | IBM's own entry |
Lotus also made a costly choice: it largely ignored the Macintosh market. The revenue looked small, but building a graphical spreadsheet on the leading GUI taught Microsoft useful lessons with Excel for Mac while Lotus stayed focused on the IBM PC.
Features from the 1980s we mostly lost (and maybe did not need)
- Keyboard-first command menus. Lotus 1-2-3 power users navigated faster than many modern mouse-only users. The "/" menu system was muscle memory.
- R1C1 notation as default. Multiplan and VisiCalc used row-column relative references. A1 won for readability, but R1C1 is still useful for auditing formulas across copied ranges.
- Integrated database in the spreadsheet. Lotus 1-2-3's third pillar. Modern apps split this into Airtable, Notion, and SQL.
- Simplicity as a feature. VisiCalc did not try to be a word processor. Today's Excel ships with VBA, hundreds of menu items, and decades of accumulated UI.
- Split-screen and simultaneous views. Some 80s packages let you see two regions of the same sheet at once without relying on freeze panes.
In 1985, Lotus acquired Software Arts and discontinued VisiCalc. A Lotus spokesperson told reporters that "1-2-3 and Symphony are much better products so VisiCalc is no longer necessary" (per D.J. Power, A Brief History of Spreadsheets).[14]
1990s
The Industry Emerges
Pivot tables, VBA, lawsuits, and the tipping point toward Excel
Lotus engineers shipped Improv in 1990 with pivot tables years before Excel had them, then asked mainstream offices to abandon the familiar grid and buy a NeXT instead of a Mac or PC. Bold bet. Wrong audience.
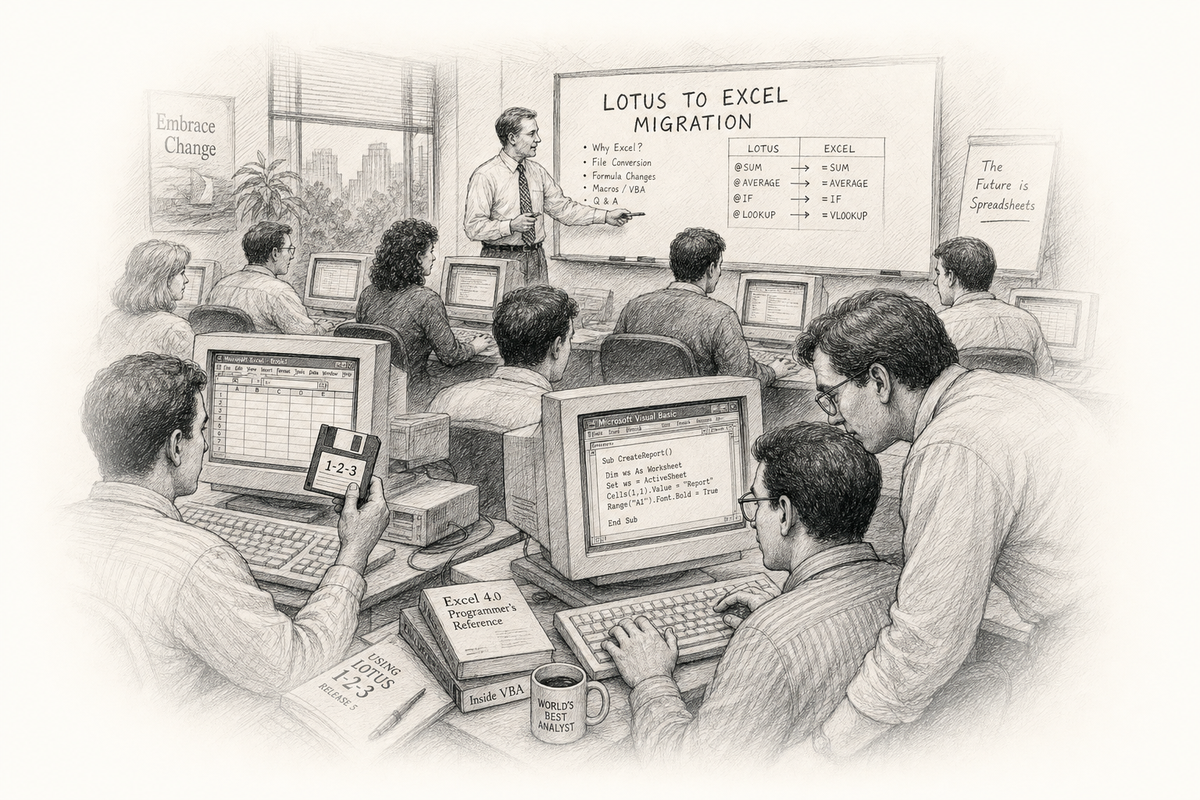
By 1993, journalists were writing Lotus obituaries. Most people who switched from Lotus to Excel did so between 1993 and 1995. Excel shipped a Lotus macro interpreter so existing 1-2-3 files could keep running during the migration.[14][17]
Excel 5.0 (December 1993) replaced the Excel macro language with Visual Basic for Applications. Corporate America had been building Lotus macros for a decade. VBA turned spreadsheets into an application platform, and they have stayed that way since.

Took over as Mitch Kapor resigned. Led lawsuits against Paperback Software (VP Planner) and Mosaic (TWIN) over Lotus 1-2-3's "look and feel." Lotus won those cases but kept losing users to Excel.
Quattro Pro challenged Lotus and Excel with fast recalculation and a strong interface. Borland founder Philippe Kahn led one of several contenders that eventually lost to Excel.
Developed VP-Planner for Adam Osborne's Paperback Software, a Lotus 1-2-3-compatible spreadsheet sold at paperback prices. Lotus sued over look-and-feel; Paperback folded after the case dragged on.
The legal battles mattered. In June 1990, Judge Keeton upheld Lotus 1-2-3's copyright on its menu structure. The decision shaped software UI law for years. Lotus won in court but kept losing users to Microsoft as Windows 3.0 (1990) and Windows 3.1 pushed Excel to the front.
Lotus Improv & pivot tables
Pivot tables arrived early, but Improv ran on NeXT and dropped familiar spreadsheet habits.
Excel 5.0 + VBA
Spreadsheets become programmable applications.
IBM acquires Lotus
$3.5 billion. The independent spreadsheet era ends.
Excel 97
Row limit jumps to 32,767, with more room for bigger models and bigger mistakes.
2000s
Mass Market
Office ubiquity, OpenOffice, and spreadsheets everywhere
The 2000s did not invent new spreadsheet ideas so much as lock in the ones that already won. Microsoft Office ran most offices. Excel was the default. Every MBA learned it. IT departments tried to replace it and usually lost.
OpenOffice.org (and its descendants LibreOffice Calc and Apache OpenOffice) brought a free alternative. Governments and schools adopted it. The file format wars (.xls vs .ods) mattered to archivists more than to most users. Excel had already won the mindshare.
In 2006, Google acquired Writely from Sam Schillace's team at Upstartle, engineers who had already put a word processor in the browser while most vendors assumed spreadsheets would stay on the desktop. That acquisition became Google Docs and, eventually, Google Sheets. The browser was not yet a credible spreadsheet engine. Schillace and his colleagues spent the next decade proving it could be.
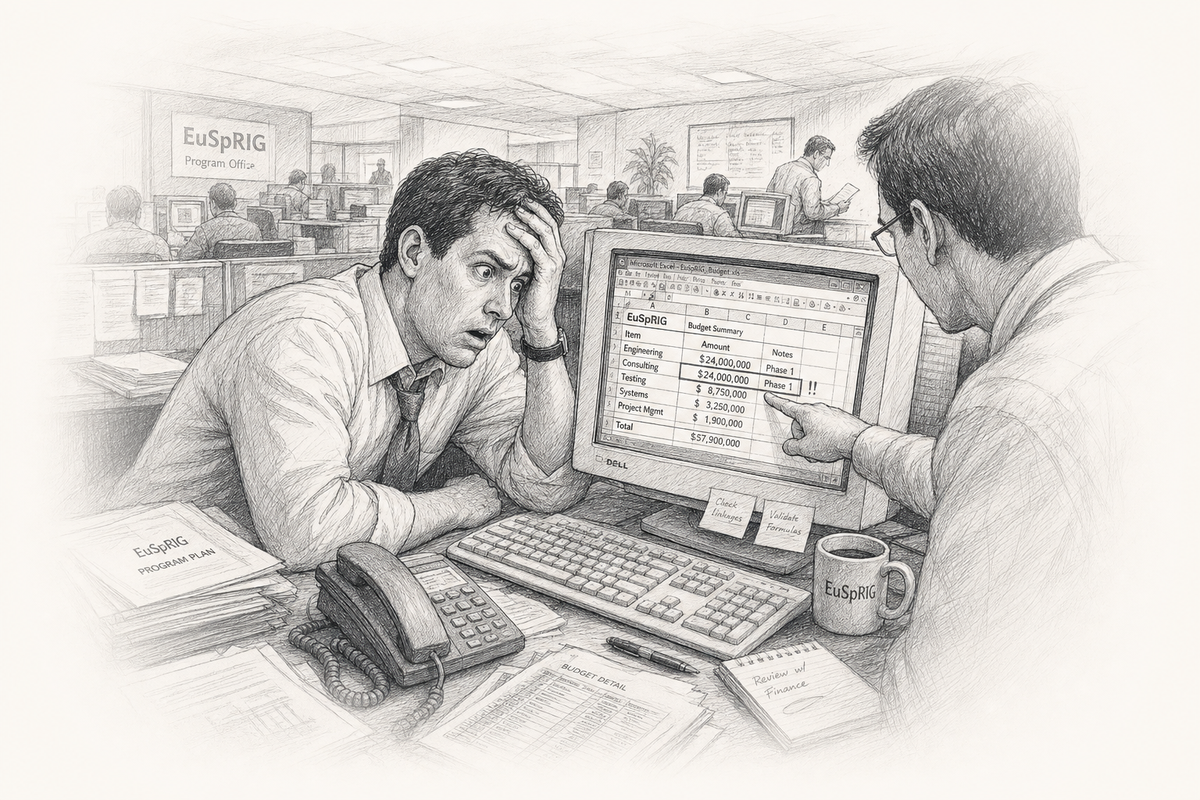
This era also produced famous spreadsheet errors. The European Spreadsheet Risks Interest Group (EuSpRIG) kept a running list. TransAlta lost $24 million to a cut-and-paste mistake. Fidelity miscalculated a $2.6 billion dividend.[8]
2010s
The Cloud
Google Sheets, Airtable, and the return of the database
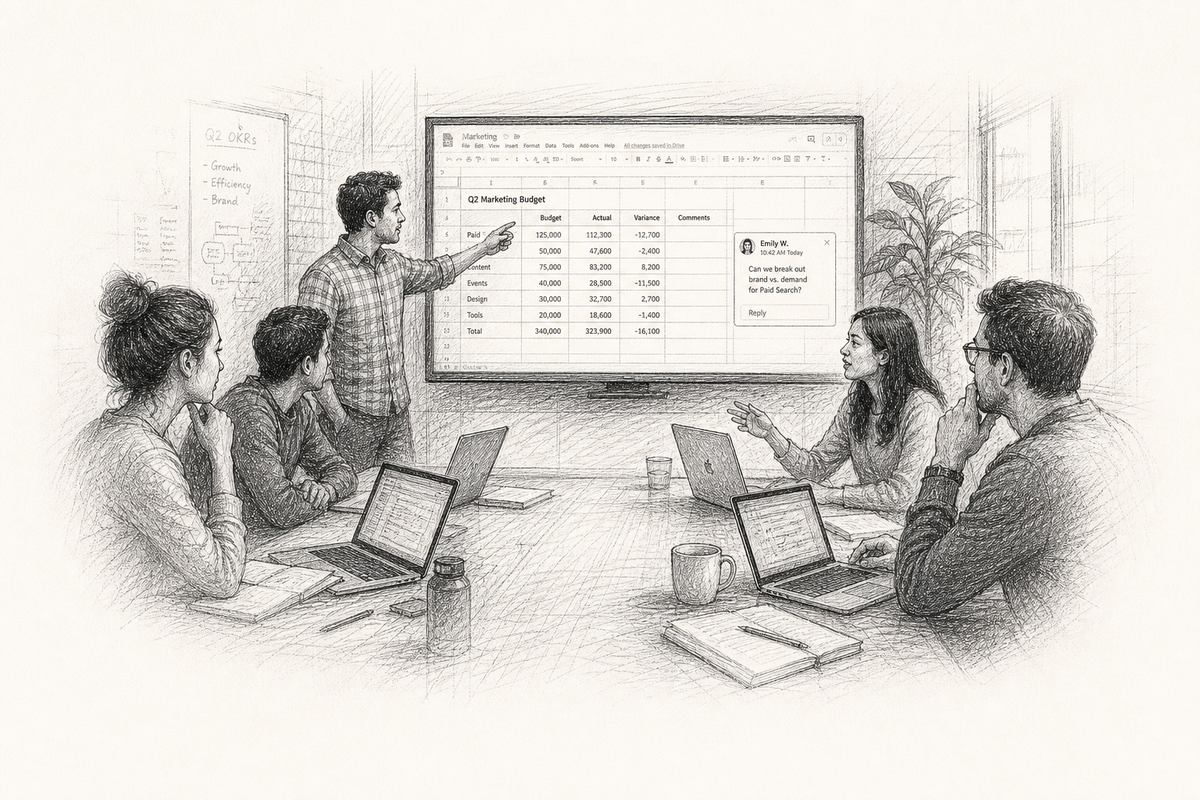
Google Sheets (rebranded from Google Spreadsheets by 2012) showed that a browser could run a serious grid. Real-time collaboration, shared cursors, comments, and version history gave it an edge Excel did not match at the time.
Airtable (founded 2012) combined spreadsheet familiarity with relational links, views, kanban boards, and API access. Rows and columns were no longer enough for many teams.
The decade also brought Rows, Coda, Notion databases, Smartsheet, and dozens of niche players. Each took a slice: automation, docs plus data, project management, no-code apps.
Turn the grid into an app—without code
By the late 2010s, builders stopped asking users to stare at rows. They imagined a spreadsheet as backend: data in cells, experience in an interface. Glide turned Google Sheets into mobile apps. Softr connected Airtable to websites. Google bought AppSheet and made it official. The grid was no longer the destination. It was the database behind the screen.
2020s
AI in the Grid
APIs, BigQuery, machine learning, and built-in suggestions
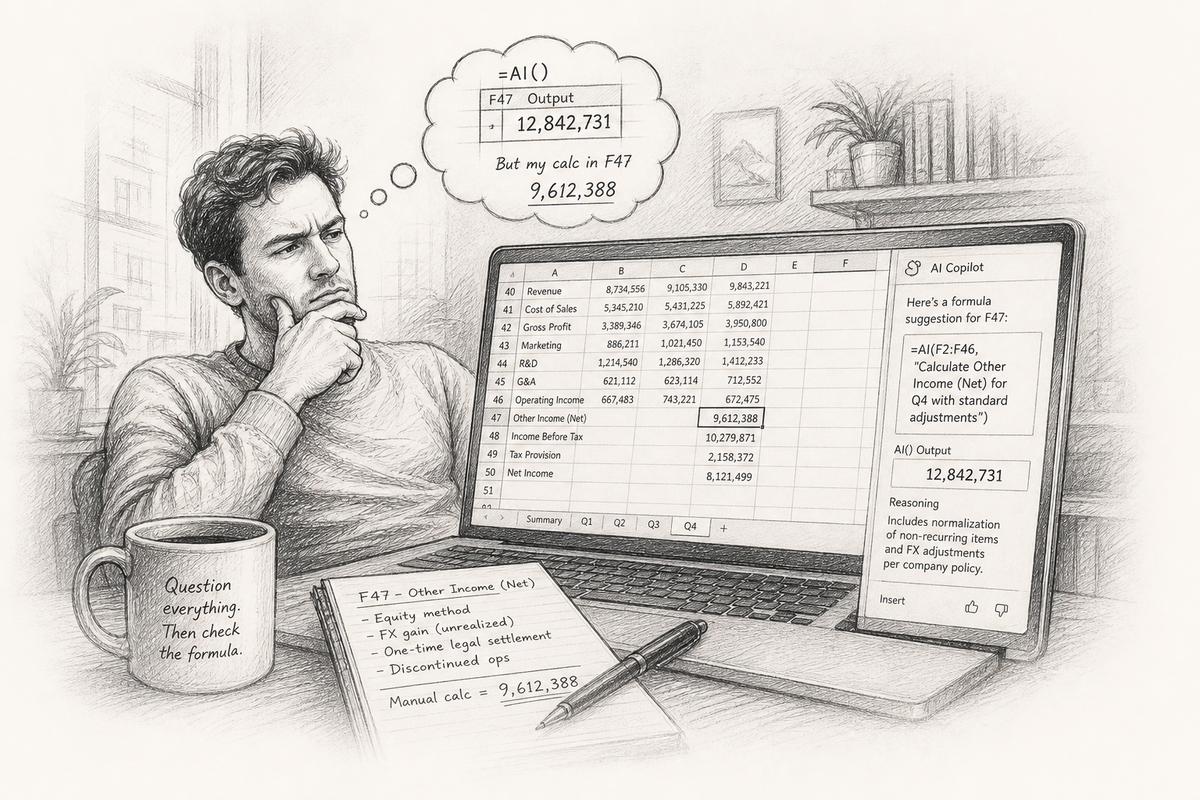
The 2020s added intelligence. Google connected Sheets to BigQuery. Explore surfaces charts without a prompt. =AI() and Copilot turn natural language into formulas. Bricklin's heads-up-display idea is closer than it was in 1978. A wrong AI suggestion in cell F47 is the same kind of problem as a cut-and-paste error.[2][4]
Better Sheets lives in this era, teaching Apps Script, automation, and workflows that turn a shared grid into something your team can run. Browse courses →
2030s
40% of the World
Two billion users is not saturation. What comes after the grid?
Some estimates put spreadsheet users at roughly 40% of all internet users, more than two billion people. Excel is a generic noun in many offices ("send me an excel"). Google Sheets is the default for startups and schools.
Will the next spreadsheet still look like a grid? Bricklin imagined a cockpit with heads-up displays and simulation. AR and VR might change how data is arranged. Or the grid disappears entirely and lives only as a backend for other tools.
Guinness World Records recognized Ariel Fischman for the largest collection of physical spreadsheet software: 506 boxed titles verified in Mexico City in 2018, spanning VisiCalc-era floppies to rare beta releases.
Ariel Fischman 414 Capital · Collector
The word catches up
The Google Books Ngram for spreadsheet barely moves for a century, then climbs fast after 1980. The two-word form spread sheets fades as the compound takes over.

Sheetscape
Who makes spreadsheet software today, and who used to
A map of the industry: the big three, the challengers, and the dead products along the bottom.
The Big Three
-
 Microsoft Excel
1.5 Billion Active Users
Microsoft Excel
1.5 Billion Active Users
-
 Google Sheets
3 Billion Workspace Users
Google Sheets
3 Billion Workspace Users
-
 Apple Numbers
2.5 Billion Devices
Apple Numbers
2.5 Billion Devices
Challengers
-
LibreOffice
-
OnlyOffice
-
Collabora
-
OpenOffice
-
WPS Office
-
Hancom
-
Polaris
-
Zoho Sheet
-
Airtable
-
Notion
-
Coda
-
Rows
-
Smartsheet
-
Monday.com
-
ClickUp
-
Asana
-
Baserow
-
NocoDB
-
Grist
-
SeaTable
-
Quadratic
-
Stackby
-
Ragic
-
Fibery
-
Budibase
-
Ninox
-
TeamDesk
-
Caspio
-
Quickbase
-
Knack
No-code Builders
-
Glide
-
Softr
-
AppSheet
-
Stacker
-
Retool
-
Clay
-
Bubble
-
Adalo
-
Thunkable
-
Spreadsheet.com
-
Better Sheets
-
Lovable
-
Placid
-
Sheetgo
Automation
-
Zapier
-
Make
-
-
Coupler.io
-
Fivetran
-
Supermetrics
-
Tray.io
-
Workato
-
n8n
-
-
Power Automate
Spreadsheet Graveyard
- LANPAR
-
VisiCalc
- SuperCalc
- ZX81 Memocalc
-
-
Lotus 1-2-3
- Dynacalc
- PFS Plan
-
- Boeing Calc
- Framework
- Lotus Jazz
- 20/20
- Javelin
- VP-Planner
- The Twin
- Context MBA
- PlanPerfect
- Wingz
- Quattro Pro
- VisiPlot
-
- 3D-Calc
-
Claris Resolve
- As-Easy-As
- Enable
- SmartWare
-
- iRows
- EditGrid
- Resolver One
-
Hundreds of creators on YouTube and blogs teach spreadsheet skills: Better Sheets among them, plus channels on Excel formulas, Google Apps Script, financial modeling, and no-code automation.
Spreadsheet Opportunities
Where AI, interface design, and the grid still fall short
Spreadsheet software is about fifty years old and still growing. Microsoft and Google are bolting AI onto chat sidebars and =AI() cells. The grid itself has barely moved.
What AI still misses
Copilots draft VLOOKUPs and explain errors. They stumble on the real work: exploring a model, testing assumptions, trusting the result.
- Explainability in the cell. Copilot suggests a formula. You accept it. Why that structure? What breaks if you change one input?
- Deterministic AI. =AI() can return different text on repeat runs. Forecasting and compliance need answers you can reproduce.
- Agents on ranges, not workbooks. Real work happens in a block of cells: clean this column, find Q3 outliers, model an 8% rent hike.
- Structured extraction. Pulling tables from PDFs and invoices into typed columns is still manual or brittle.
- Natural language that compiles. "Revenue by region, stacked bar, exclude returns" should produce a live view, not a screenshot.
Interface and experience gaps
VisiCalc put a grid on screen in 1979. Excel added ribbons in 2007. Google Sheets added real-time cursors. The core interaction model is largely the same: infinite rows, A1 references, a formula bar above the sheet.
- Dependency maps you can click. Precedents and dependents exist as menu items. A visual graph of what feeds cell F47, with one-click navigation, would help anyone debugging a model they did not build.
- Mobile that is not a compromise. Sheets on a phone is read-mostly. Editing formulas, selecting ranges, and reviewing wide tables on a small screen is still painful.
- Onboarding without a course. Millions use spreadsheets daily and never learn INDEX/MATCH or pivot tables. Inline help at the point of need would close the gap faster than another tutorial.
- Collaboration with intent. Shared cursors show where someone is, not what they mean to change. Lock regions. Propose edits on sensitive cells.
- Views beyond the rectangle. Kanban, calendar, map, and timeline views exist in Airtable and Notion. The classic grid is one lens. Switching views without losing the underlying model is still rare in mainstream spreadsheets.
- Error states people understand. #REF!, #N/A, and circular reference warnings assume you already speak spreadsheet. Plain-language explanations at the cell level would save hours of forum searching.
Problems neither AI nor UI has solved
Some gaps are older than the current AI wave:
- Auditability. Who changed cell F47, when, and can you prove it in court?
- Interoperability. =IMPORTXML still breaks when a source site changes its HTML.
- Scale without a data warehouse. Million-row analysis for people who will never write SQL.
Bricklin imagined a heads-up display: circle a number, ask a question, see the answer. Copilot and Explore are early steps. The win is making the sheet itself smart, not just the chat box beside it.
Imagine if my calculator had a ball in its back, like a mouse... And imagine if I had a heads-up display, like in a fighter plane, where I could see the virtual image hanging in the air in front of me. I could just move my mouse/keyboard calculator around on the table, punch in a few numbers, circle them to get a sum, do some calculations, and answer "10% will be fine!"Dan Bricklin, daydream in Aldrich Hall, Harvard Business School, 1978[2]
Better Sheets
The grid is fifty years old. Your spreadsheet work is today.
Discussion, templates, tools, and seller delivery for Google Sheets builders
This history ends where your work begins. Copilots draft formulas; they rarely explain why cell F47 breaks when you nudge Q3. Better Sheets membership is the discussion layer on top of the grid: ask what’s blocking you and get a real reply from someone who lives in spreadsheets. Pair that with downloadable templates, unlimited generators, Apps Script walkthroughs, and — if you sell sheets — buyer-safe delivery through OnlySheets and our Selling Spreadsheets course.
Sources
References
Primary sources, oral histories, and published research cited in this history. Retrieved June 2026 unless otherwise noted.
- ^ . "Birthing the Visible Calculator." BYTE / aresluna.org (reprint), 1984. https://aresluna.org/attached/computerhistory/articles/spreadsheets/tenyearsofrowsandcolumns/birthingthevisiblecalculator
- ^ . "The Idea." bricklin.com, 1999. https://bricklin.com/history/saiidea.htm
- ^ . "Steve Jobs talking about VisiCalc in 1996." bricklin.com, 2012. https://bricklin.com/jobs96.htm
- ^ . "A Problem That Changed the World (TEDxBeaconStreet)." TEDx Talks (transcript via Singju Post), 2014. https://singjupost.com/a-problem-that-changed-the-world-dan-bricklin-at-tedxbeaconstreet-transcript/
- ^ . "Computerized spreadsheets first described." The Centre for Computing History, 1961. https://www.computinghistory.org.uk/det/6985/Computerized-spreadsheets-first-described/
- ^ . "Etymology of 'spreadsheet': an anachronistic use?." Stack Exchange, 2021. https://english.stackexchange.com/questions/541763/etymology-of-spreadsheet-an-anachronistic-use
- ^ . "spreadsheet (n.)." Online Etymology Dictionary. https://www.etymonline.com/word/spreadsheet
- ^ . "Spreadsheet Research and Resources." eusprig.org. https://www.eusprig.org/
- ^ . "spreadsheet / spread sheets frequency chart, 1800-2019." Google Books. https://books.google.com/ngrams/graph?content=%22spreadsheet%22%2C%22spread+sheets%22&year_start=1800&year_end=2019&corpus=26&smoothing=6
- ^ . "Oral History: Mitchell Kapor." Engineering and Technology History Wiki (IEEE), 2004. https://ethw.org/Oral-History:Mitchell_Kapor
- ^ . "The spreadsheet: Its history and applications." University of Texas at Dallas. https://personal.utdallas.edu/~liebowit/book/sheets/sheet.html
- ^ . "Budgeting Models and System Simulation." The Accounting Review, 1961. https://www.jstor.org/stable/242869
- ^ . "The Machine That Changed The World: interview with Steve Jobs (1990)." morrick.me, 2011. https://morrick.me/archives/8816
- ^ . "A Brief History of Spreadsheets." DSSResources.com, 2004. https://dssresources.com/history/sshistory.html
- ^ . "Spreadsheet: History of the Term." DSSResources.com. https://www.dssresources.com/history/mattessichspreadsheet.htm
- ^ . "Lotus 1-2-3 turns 30: Mitch Kapor on the Google before Google." The Register, 2013. https://www.theregister.com/software/2013/01/26/lotus-1-2-3-turns-30-mitch-kapor-on-the-google-before-google/
- ^ . "Excel Version History." spreadsheetpage.com. https://spreadsheetpage.com/Excel%20Version%20History
- ^ . "Lotus 1-2-3." Wikipedia. https://en.wikipedia.org/wiki/Lotus_1-2-3
- ^ . "Spreadsheet." Wikipedia. https://en.wikipedia.org/wiki/Spreadsheet
- ^ . "VisiCalc." Wikipedia. https://en.wikipedia.org/wiki/VisiCalc
- ^ . "History of the World's First Spreadsheet LANPAR 1969." YouTube, Rene Pardo channel, 2025. https://www.youtube.com/watch?v=TWy8qHKFoNg
- ^ . "VisiCalc state diagram (winter 1978-1979)." bricklin.com, 1999. https://bricklin.com/history/saiidea_m.htm
- ^ . "VisiCalc: Information from its creators." bricklin.com. https://bricklin.com/visicalc.htm