 Better Sheets
The chart with no units
You compare two topics and get a line that tops out at 100. A hundred what? If one of them is big, the other drops to a flat zero, and you still can't tell whether zero means a handful of readers or a stadium full.
See how many people read the Wikipedia page of each thing you're comparing, every month since 2015. Paste up to five topics into the Wikipedia Trend Tracker and get the real counts on one chart.
Free copy. One click with Google.
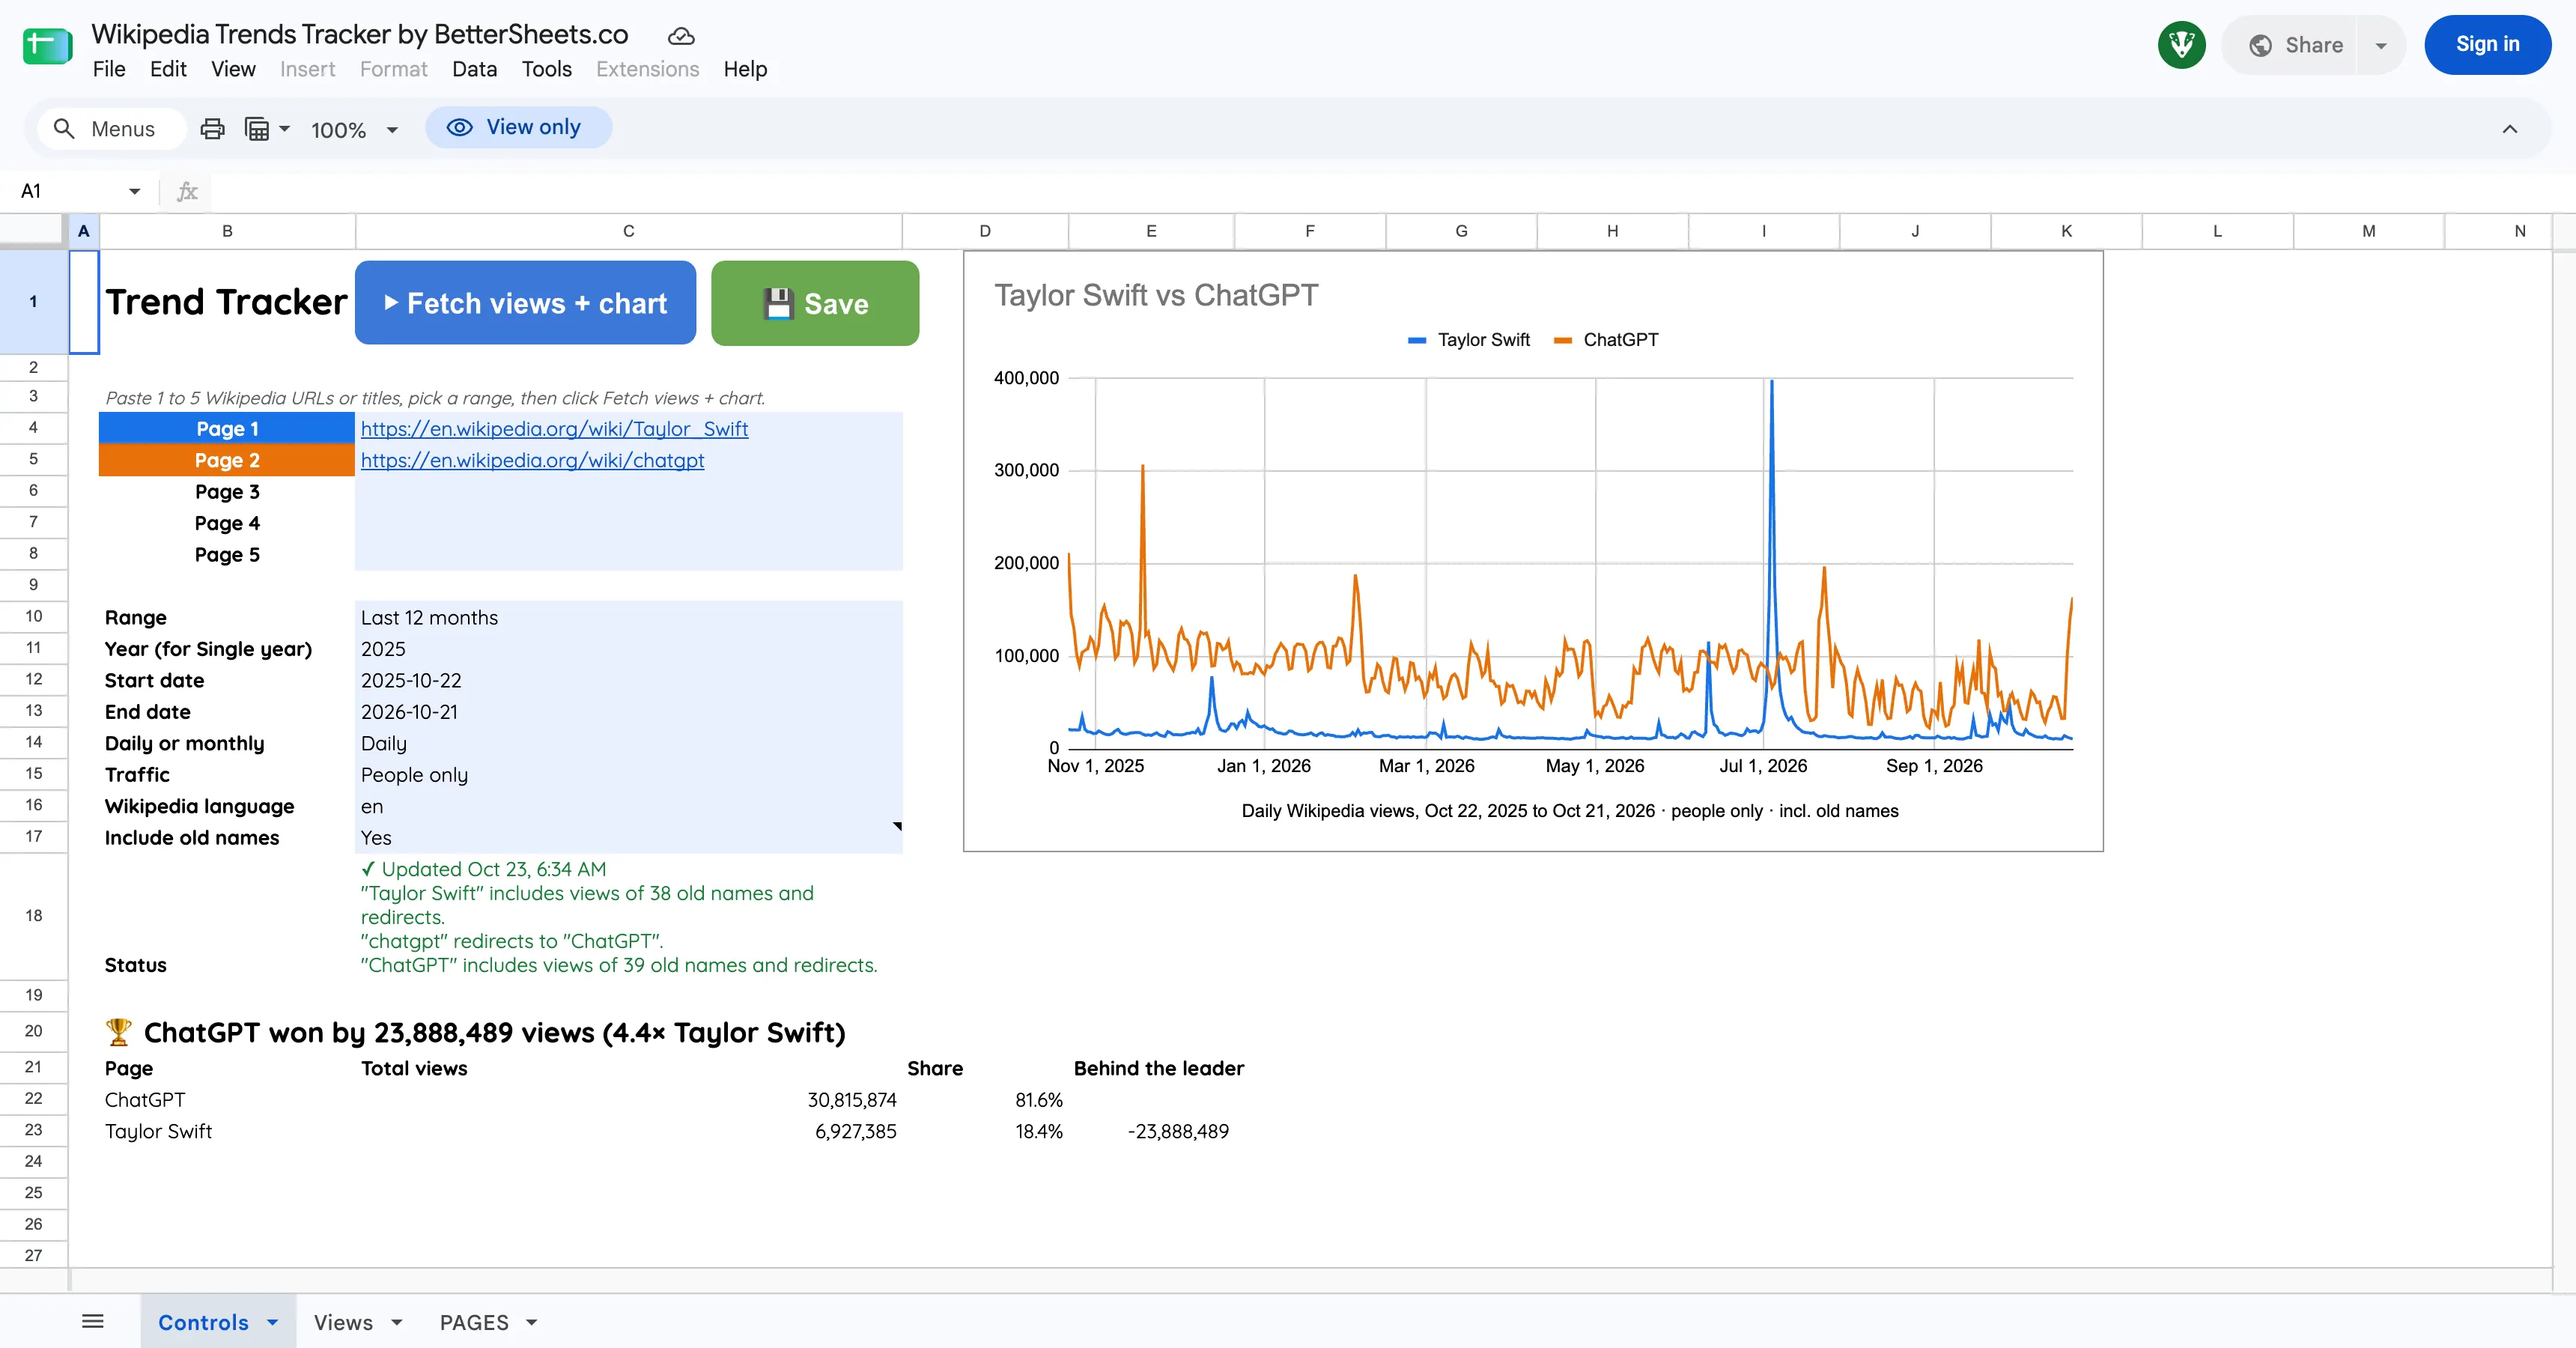
Every number comes from Wikipedia's public page-view API. Open the raw data yourself →
You've checked the trend line, the keyword ranges and three forum threads. You still don't know how many people this is, or whether it's growing.
You compare two topics and get a line that tops out at 100. A hundred what? If one of them is big, the other drops to a flat zero, and you still can't tell whether zero means a handful of readers or a stadium full.
You're about to spend a weekend, or six months, on one of them. The last 30 days look fine. The last three years would tell you if it's climbing or quietly dying, but nothing shows you that in one place.
Fifteen tabs, a hand-made spreadsheet, a screenshot of a chart you half trust. By the end you're picking the one that seems most fun to make, which is the method that failed last time.
Paste your topics and you get the actual number of people who read about each one, month by month, as far back as 2015. One chart, one winner, and the data stays in your sheet.
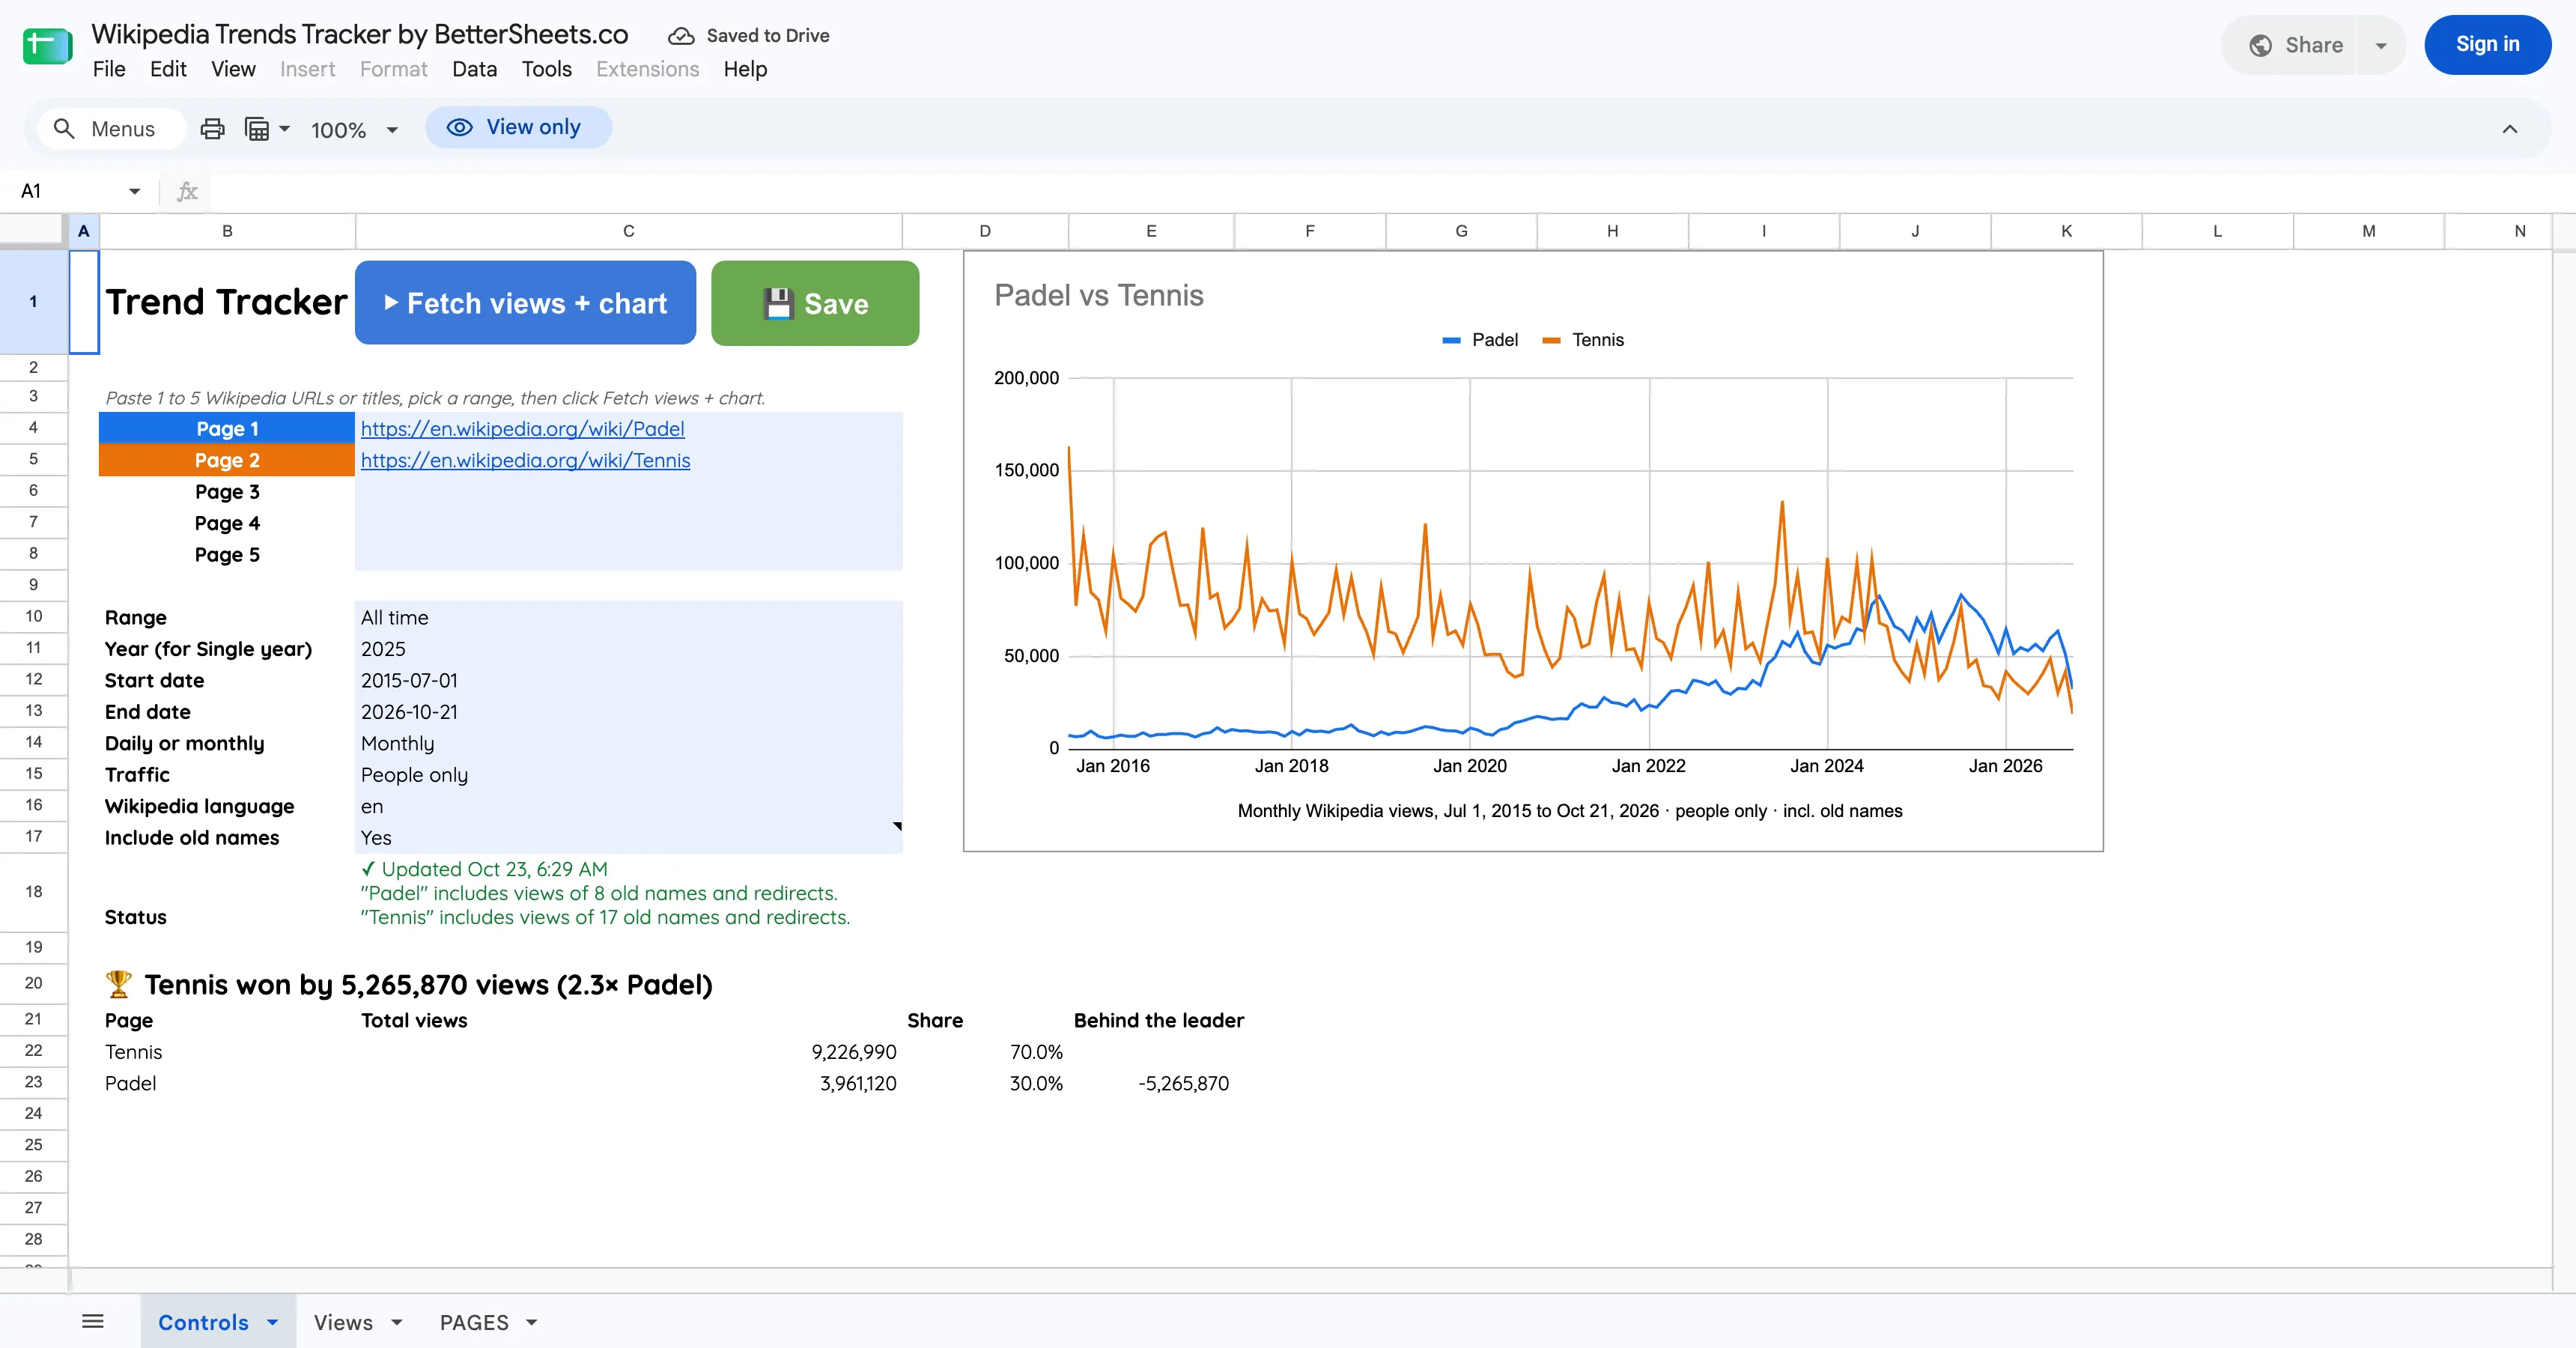
Tennis 9,226,990Padel 3,961,120
No API key, no script to set up. The sheet does the fetching.
Drop in Wikipedia links or just the names. "chatgpt" finds ChatGPT, and a renamed page keeps its old history if you want it.
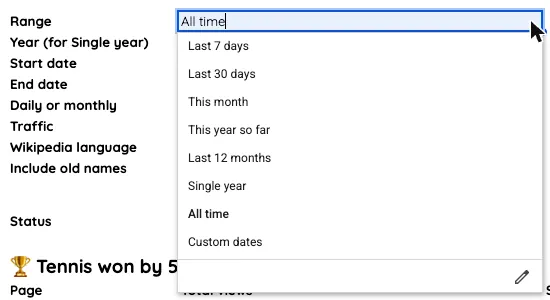
Last 7 days, this year, any single year, or all time back to July 2015. Daily or monthly.
The chart redraws, and a line under it says who got more readers and by how much. The raw numbers land on the Views tab.
Everything in the sheet exists to turn a vague trend line into a number you can act on.
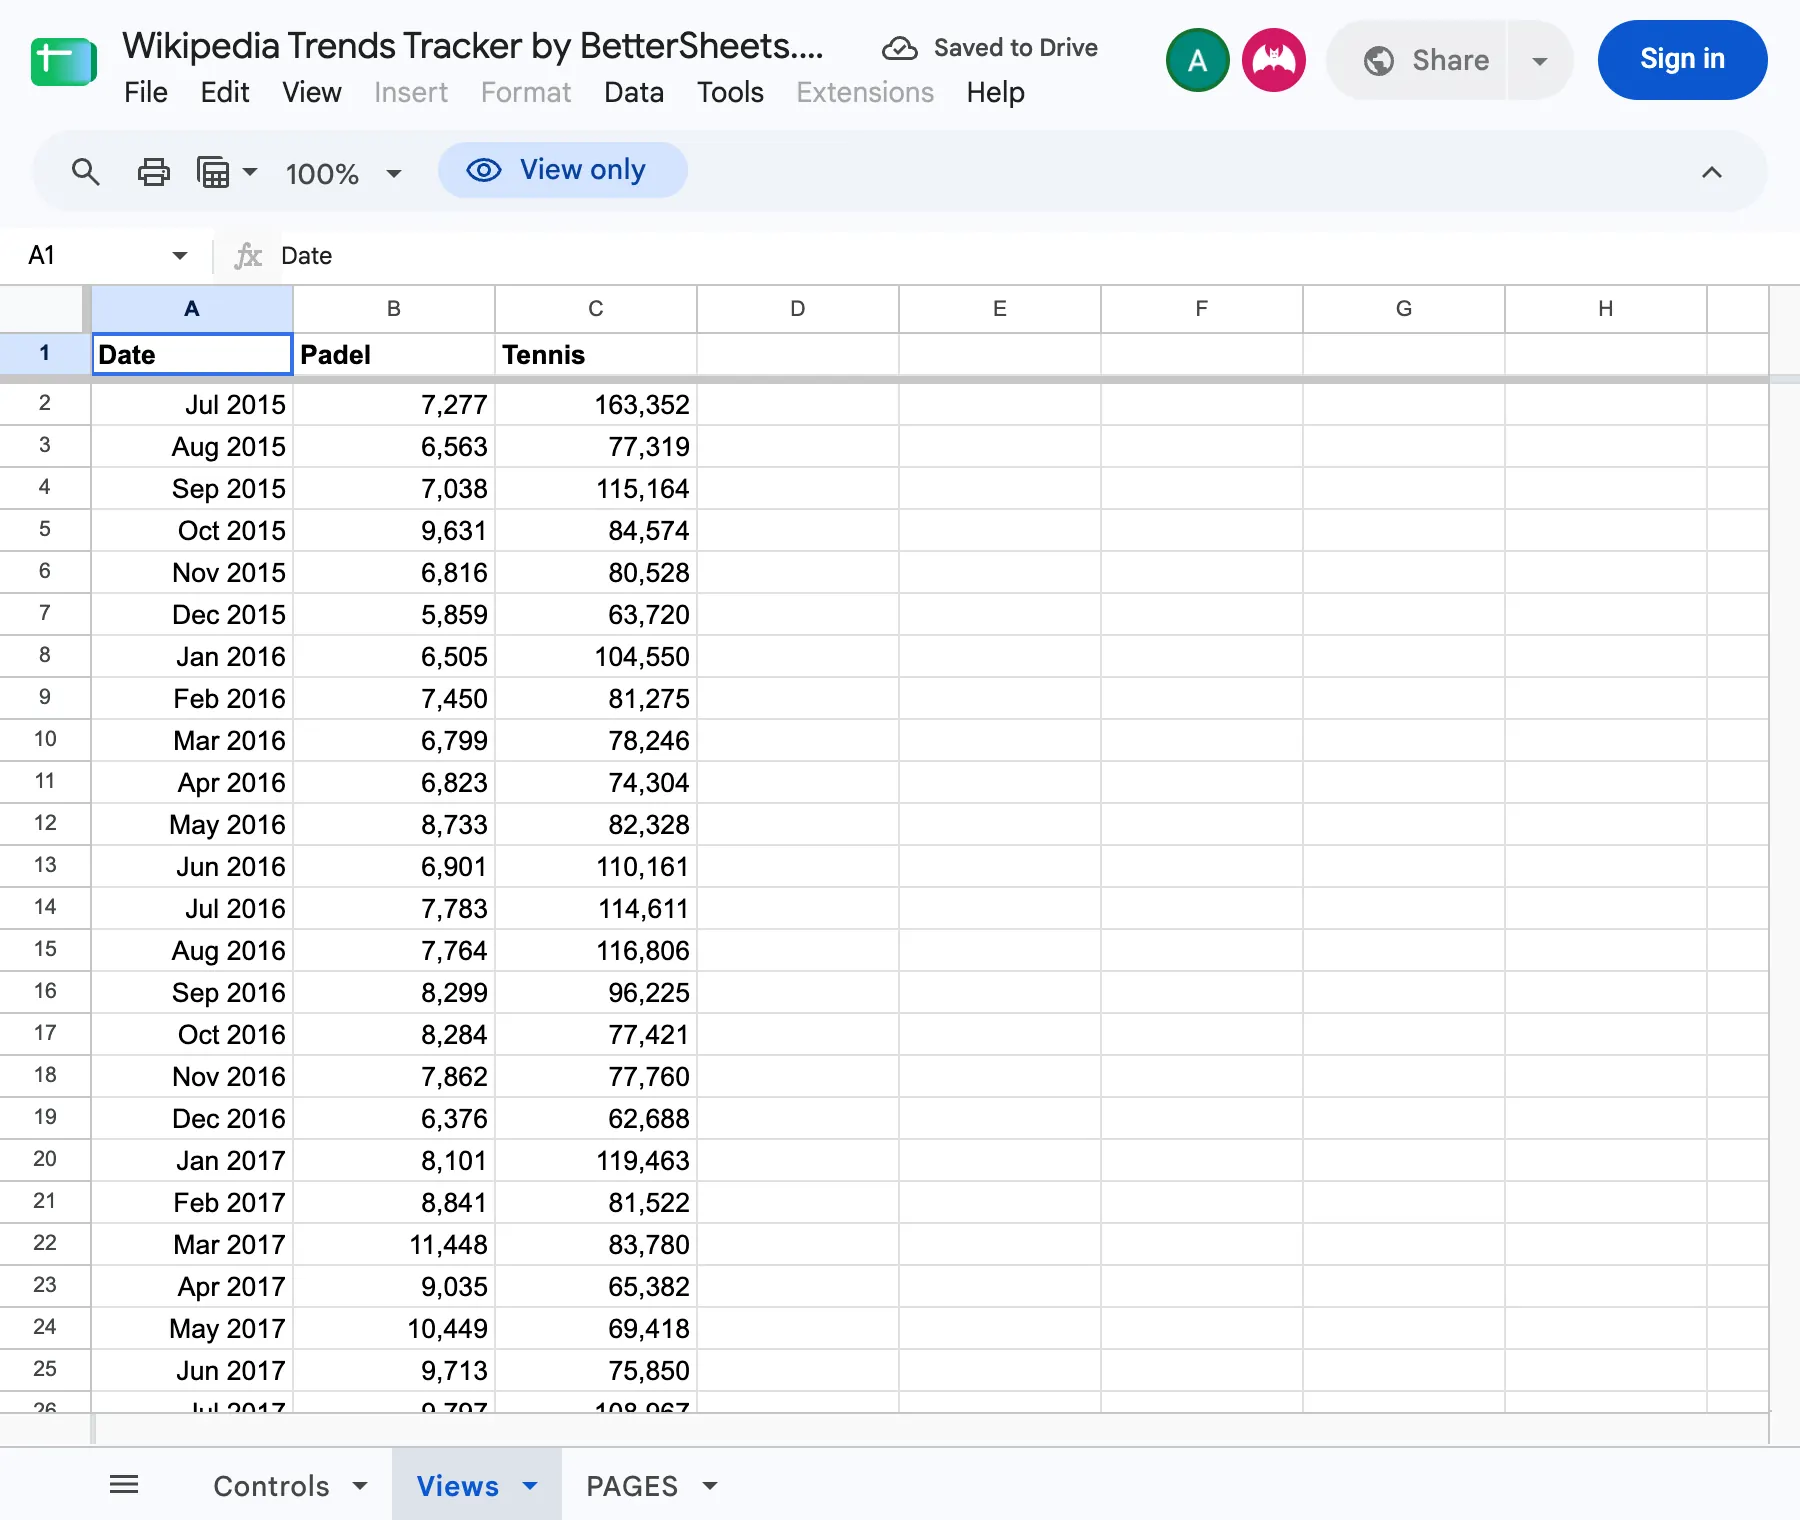
Every point on the chart is a count of people who opened that article that day or that month. Not a score, not an estimate, not scaled to a peak. The same month shows the same number whether you ask for one month or ten years.
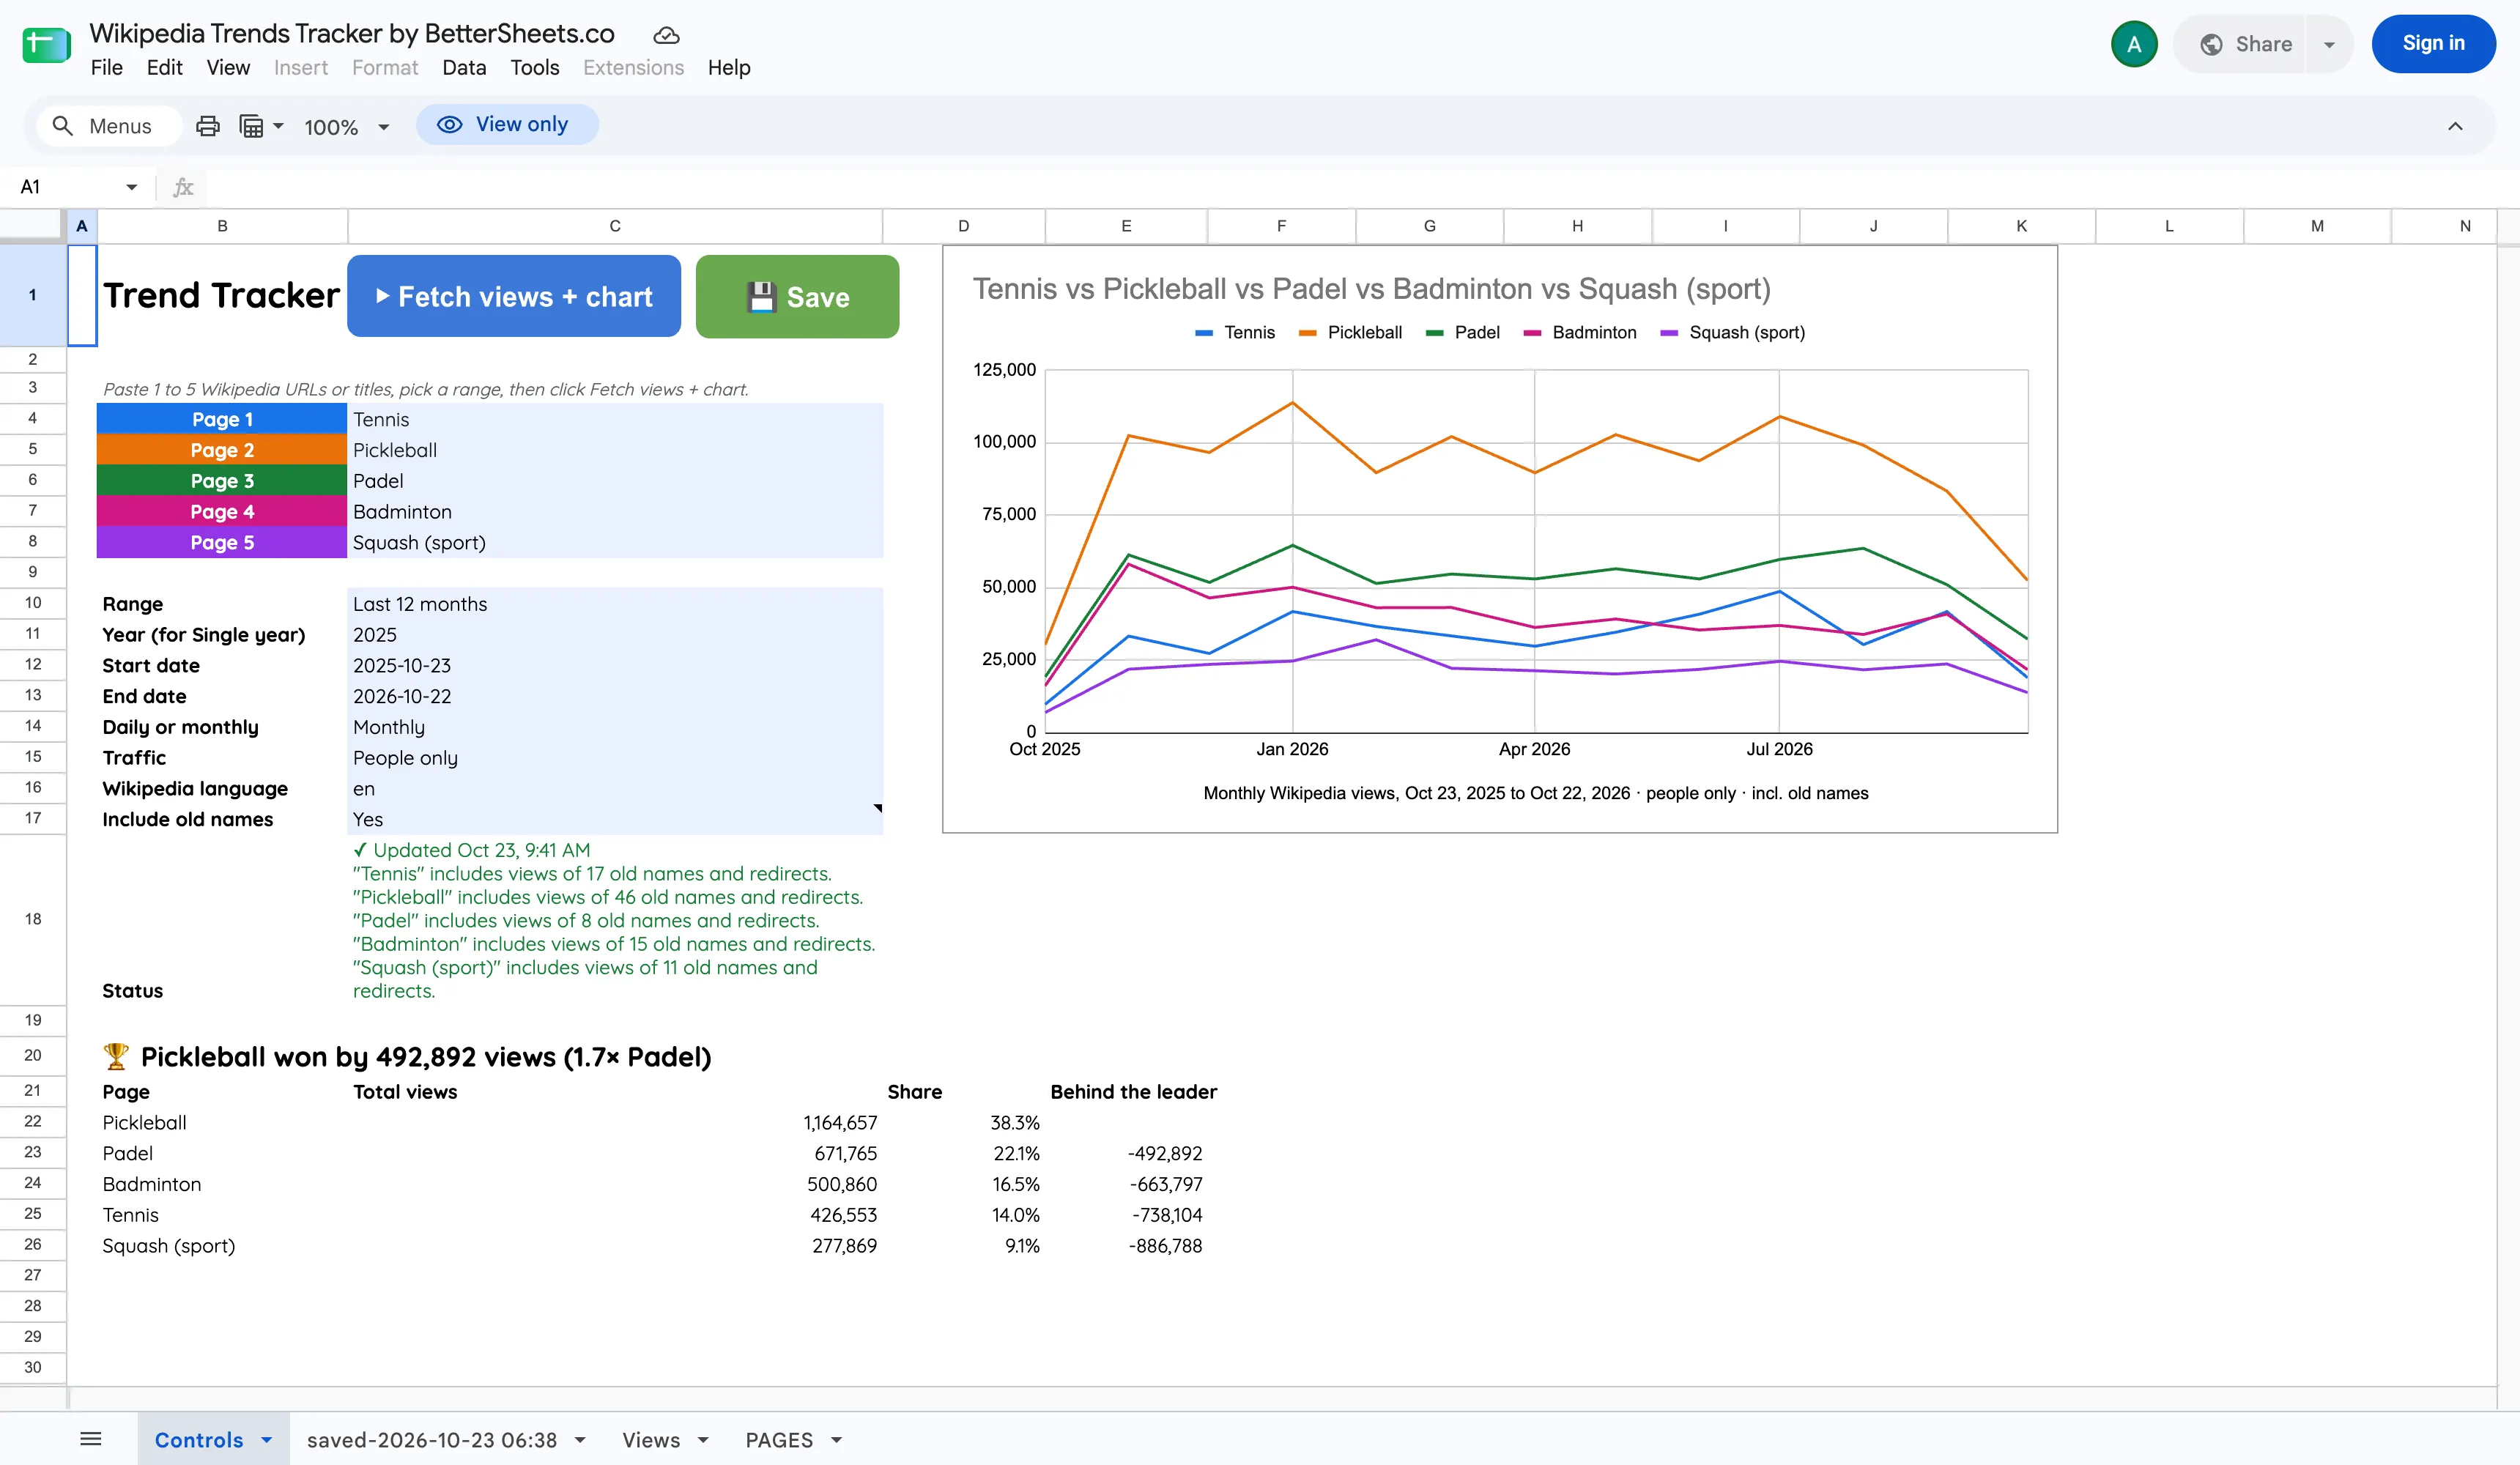
Five racket sports on one chart, each with its real count. Pickleball had 1,164,657 readers in the last 12 months, almost three times Tennis's 426,553, and Squash still shows its 277,869.
Last 30 days
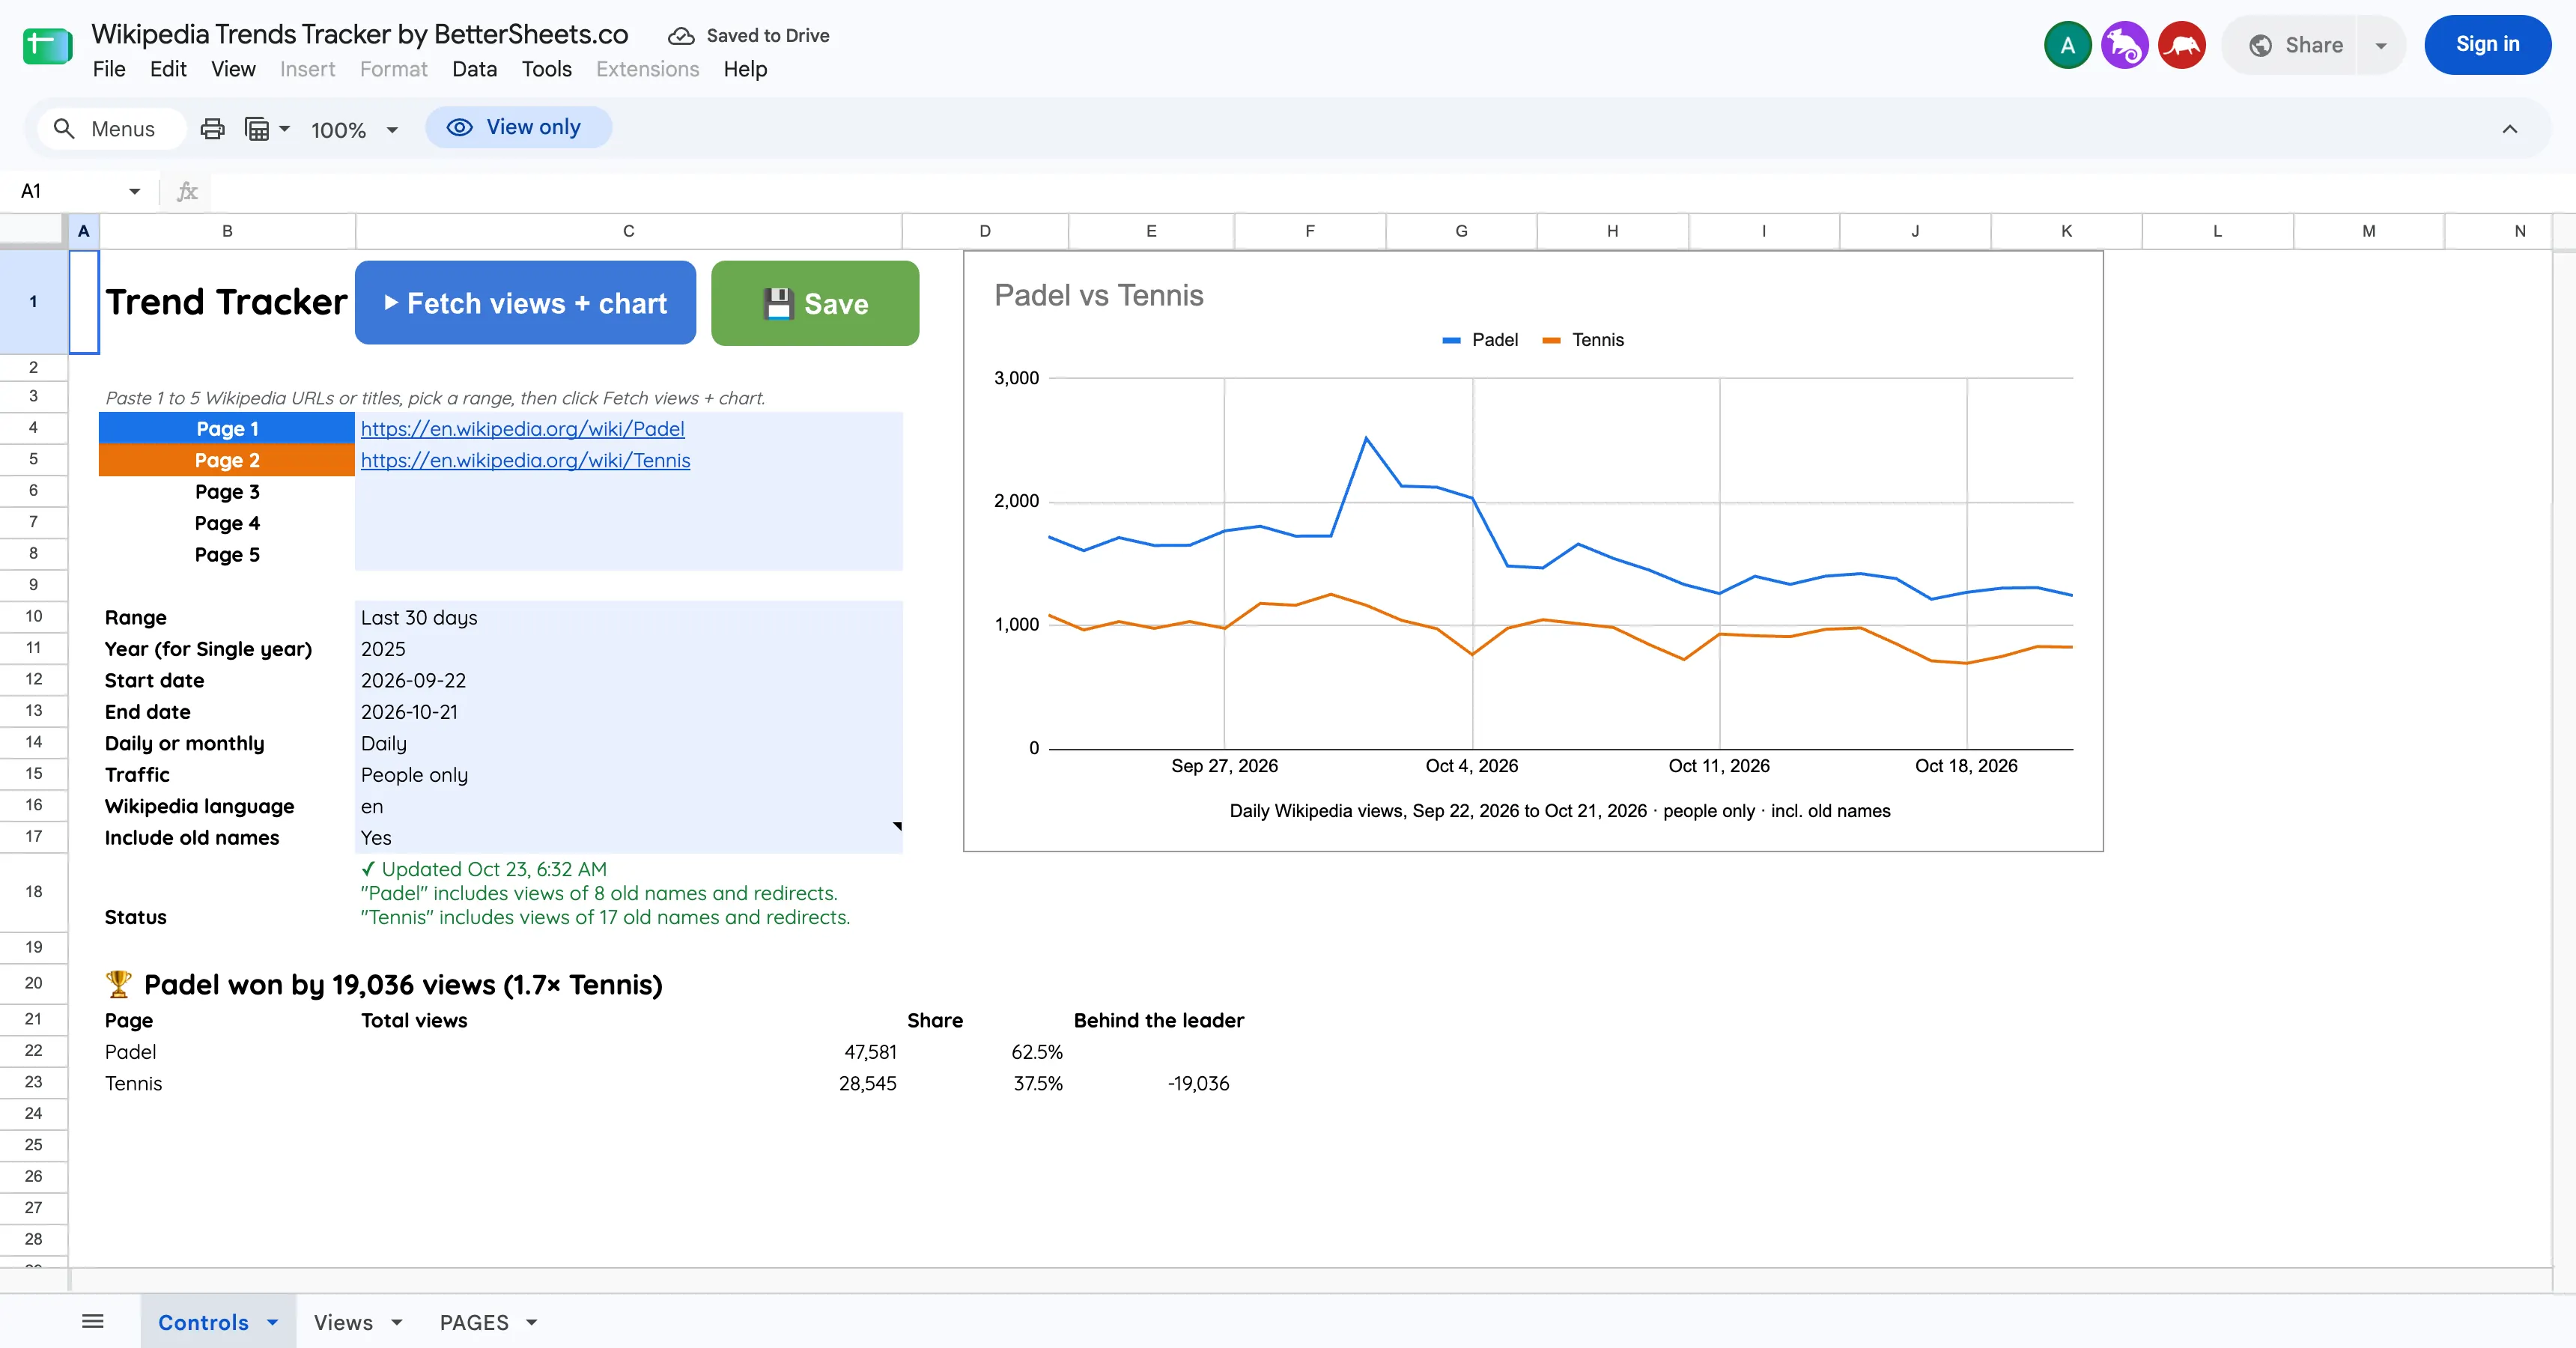
Padel 47,581Tennis 28,545
All time
Tennis 9,226,990Padel 3,961,120
Switch between last 30 days and all time in one dropdown, or type your own dates. Daily shows the spike; monthly shows whether the baseline moved after it.
After each fetch the chart redraws and a headline says who won and by what multiple, with a table of totals and share. The line for a slide or a client is already written.
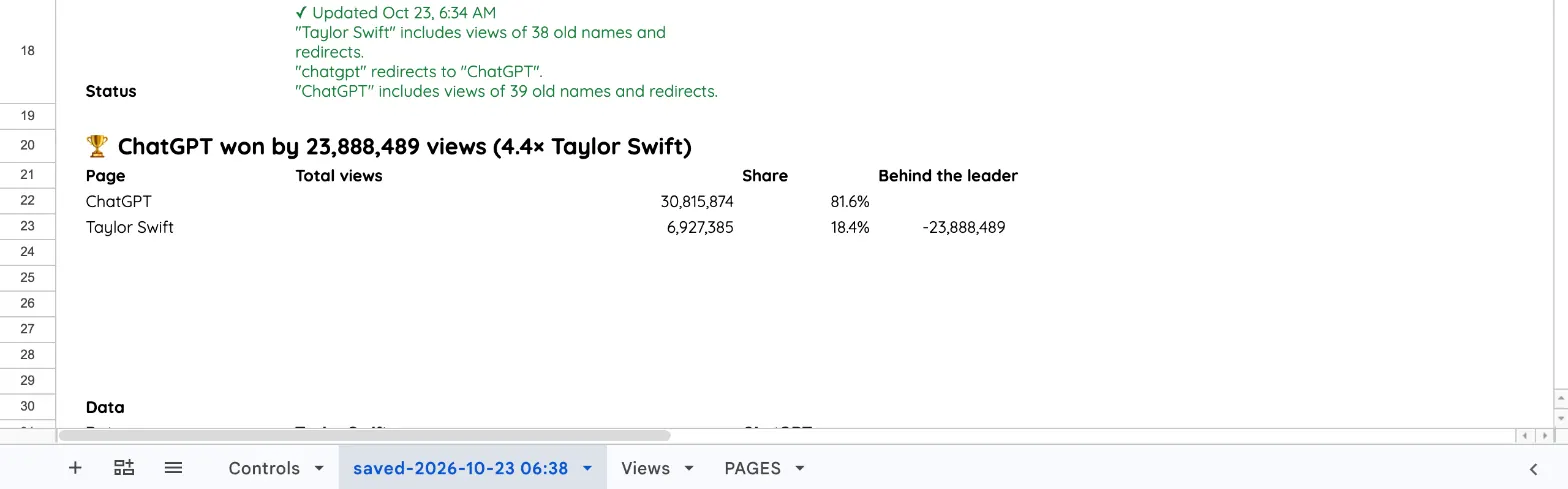
One menu click copies today's chart, totals and data to a dated tab, so next month's fetch doesn't overwrite the comparison you already used.
Free copy. One click with Google.
Each one is a page you can open now. Same API, same counts, human readers only.
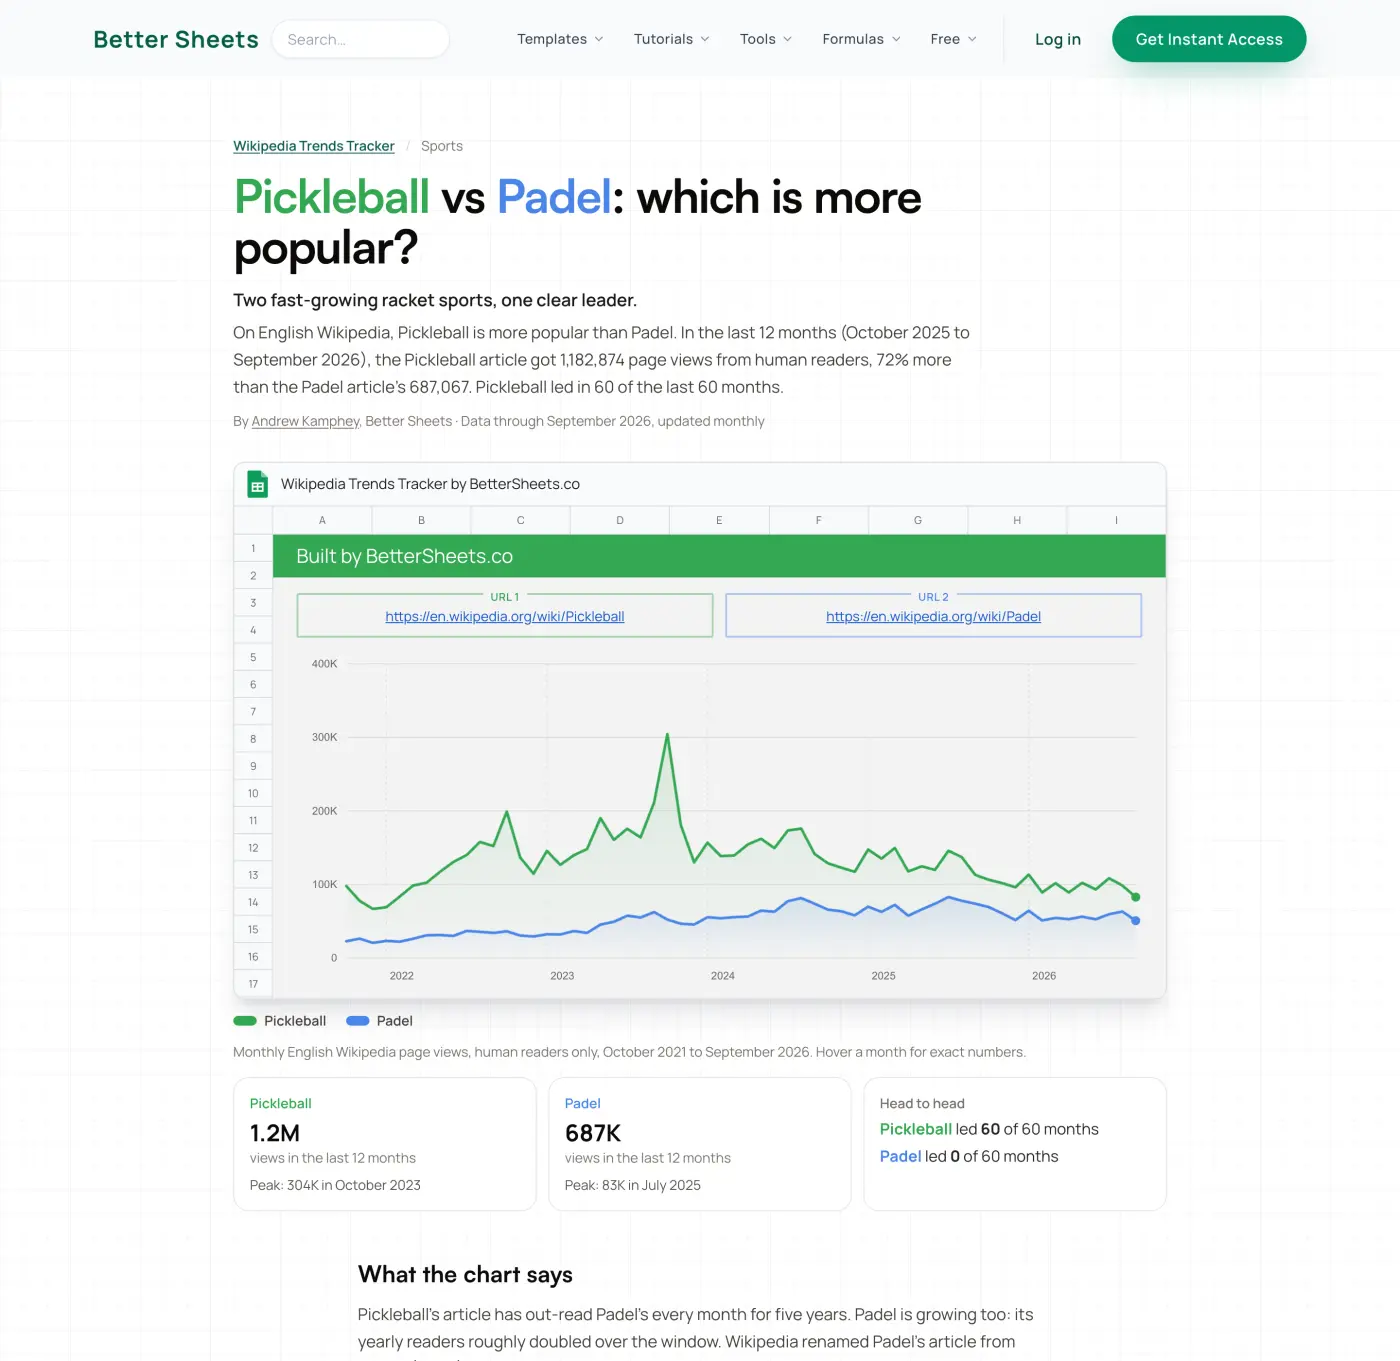
Pickleball vs Padel: Pickleball led in 60 of the last 60 months.
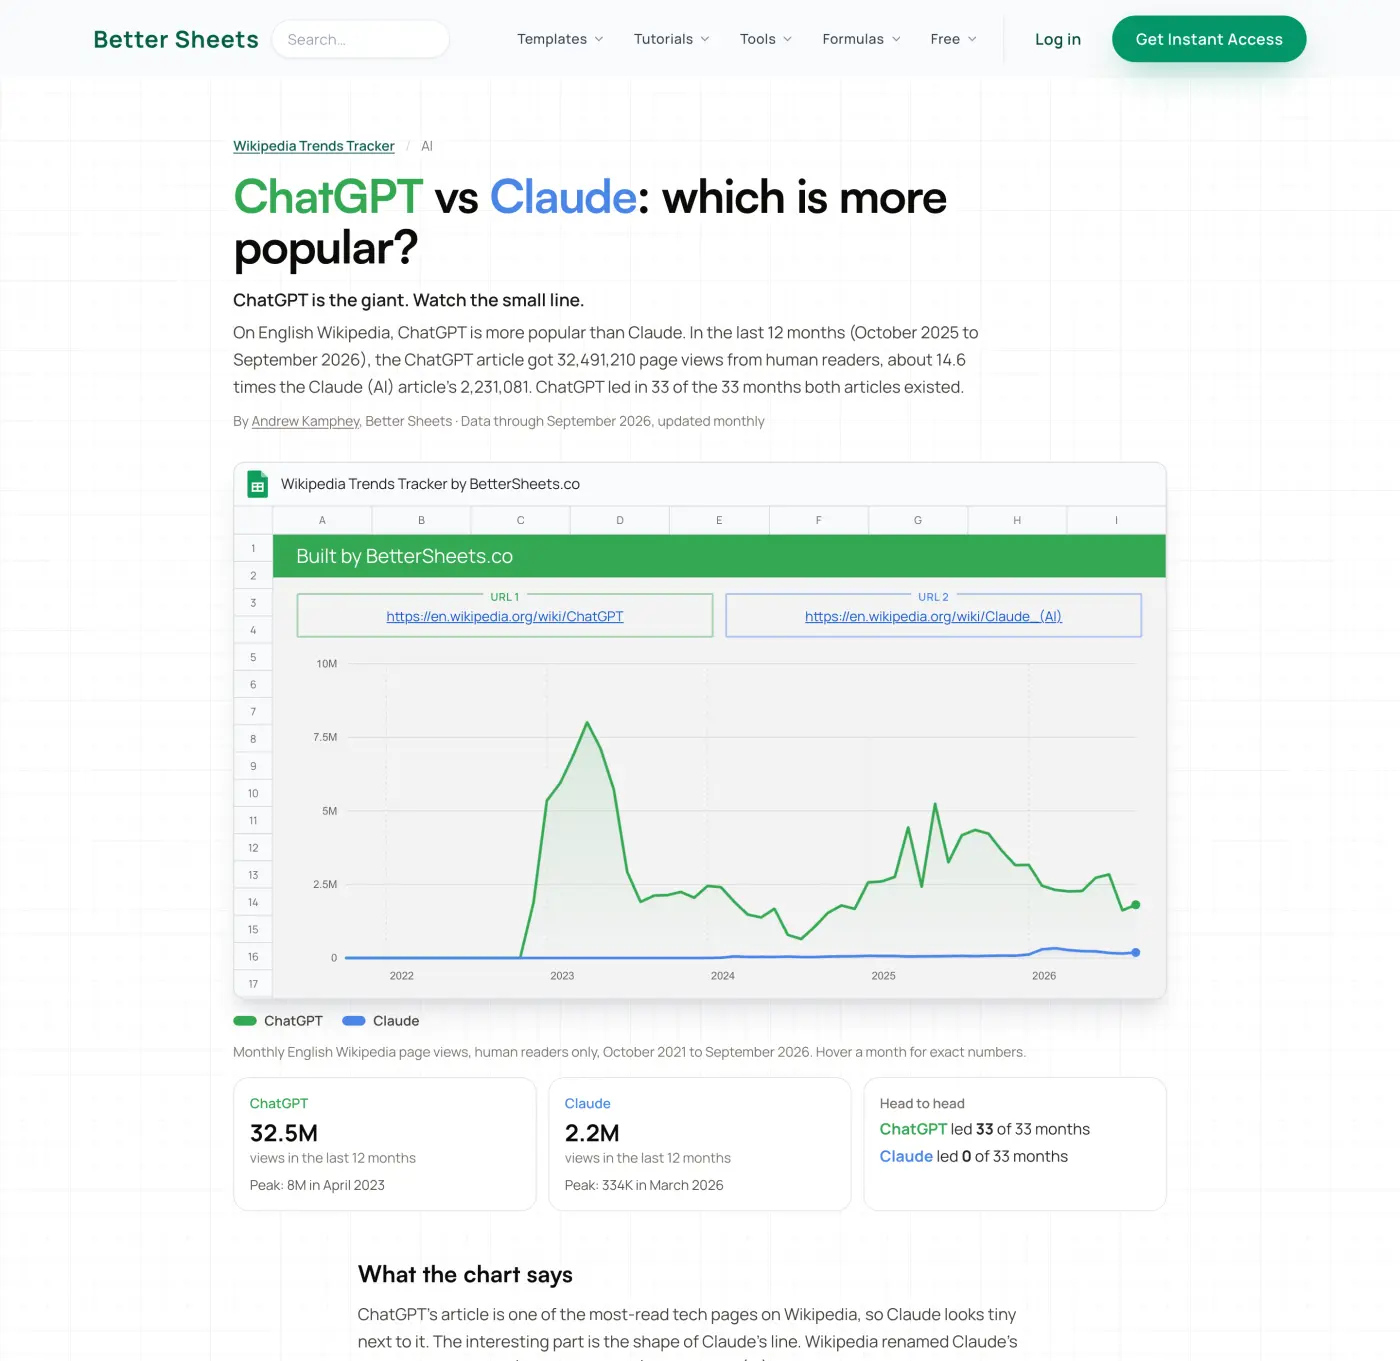
ChatGPT vs Claude: the giant, and the small line you can still read.
people have copied the sheet (as of October 2026)
months of data per topic, July 2015 to today
live comparisons on this site
Google Sheets tutorials behind it
Same decision, two Sunday nights.
| With | Without | |
|---|---|---|
| How many | A count for each idea, side by side | Keyword ranges like "1k to 10k" |
| Over time | Ten years in one chart, daily or monthly | A 0 to 100 line that rescales when you change the dates |
| Time it takes | One fetch, about a minute | Fifteen tabs and an hour per niche |
| What you keep | The data stays in your sheet to reuse next month | A screenshot you can't quote |
| What it costs | Free, and it stays free | A trial that turns into a yearly charge |
The whole sheet, every feature, no upgrade behind it.
Make a free Better Sheets account with one click, and the copy link is on the same page. No card, no trial, nothing to cancel.
Grab the free Google Sheet →Free copy. One click with Google.
No. It shows search interest scaled from 0 to 100 against the busiest point in your chosen range, and it hides low-volume terms entirely. This sheet shows the actual number of people who opened a Wikipedia article, so you can say how many, not just how much more.
This is one. Wikipedia publishes the view count of every article through a free public API, and the sheet pulls those counts for your topics. No tier, no monthly cap on searches.
Look at a few years of monthly counts, not the last month. A trend keeps a higher baseline after each spike; a fad spikes and falls back to where it started. Pick "All time" in the sheet and read the shape of the line.
On any article, open Tools, then Page information, then Page view statistics. That shows one page at a time. Paste the same link into the sheet to see it next to up to four others, charted.
Because a 0 to 100 scale is set by the biggest thing on it, and anything under a cutoff is dropped. A count has no cutoff. A page with a few hundred readers a month shows a few hundred.
No. January 2025 for Padel is 68,598 whether you ask for that one month, two years or everything since 2015. A count isn't rescaled.
Not by default. The sheet counts people only, and you can switch to all traffic. Wikimedia separates human readers from known crawlers. A sudden one-day spike can still be an undetected bot, so judge trends by months, not days.
No, because you compare topics against each other: read the ratio and the shape, not the raw height. The sheet's winner table shows each topic's share for exactly that reason.
Yes, it's free, and no card is needed. You make a free Better Sheets account with one click, and the copy link appears on that page. No trial, no paid tier of the sheet.
No. The Wikipedia API needs no key, and the script inside the sheet builds and fetches the URLs. You approve the script once when you first click Fetch.
Up to five topics on one chart, back to July 1, 2015, which is when Wikimedia's page-view data starts. Daily or monthly.
No. It counts people who read about a topic, not people who searched for it. Treat it as a measure of attention: the two move together for most topics, and sustained reading interest is often the better sign of a lasting trend.
Paste your two ideas tonight. The chart takes a minute, and the number is yours to keep.
Free copy. One click with Google.