Guest post by Jane Clark. Jane works on chart.video. Want to write for Better Sheets too? Here's how guest posts work.
Google Sheets can't animate a chart or export a video on its own. It is still the best place to build a bar chart race, because almost all of the work is getting the table right. Once the table is right, the animation takes minutes.
The short version:
- Reshape your data so there is one row per date and one column per item.
- Turn the numbers into running totals, so the bars only climb.
- Fill the gaps, so a blank doesn't get mistaken for a zero.
- Publish the tab as a CSV link, or copy the cells.
- Load it into a bar chart race tool and export a video.
Below is each step, with formulas you can paste. The example is a made-up shop's order log with about 2,500 rows, covering January 2025 to June 2026 and eight products. The numbers are invented; the formulas are the point.
1. What data format does a bar chart race need?
Most bar chart race tools want a wide table:
- one row per date, in order, with the dates in column A
- one column per item, with the item names in row 1
- a number in every cell that should have one
Each column becomes a bar and each row becomes a step in the animation. Two details save trouble later. First, keep the steps even: all months, or all weeks, never a mix. Second, write the dates as text such as 2025-01. That label sorts correctly as plain text and can't be misread the way 03/04/2025 can.
Also decide what number you're racing. Monthly sales bounce up and down, so the bars jitter. Running totals ("units sold to date") only climb, so every overtake means something. Most races use running totals, and that's what we'll build.
2. How to turn an order log into a wide table with QUERY
The raw data sits on a tab called Orders, one row per order:
Orders tab
Date        Product       Units
2025-01-01  Notebook      3
2025-01-02  Desk lamp     5
2025-01-02  Water bottle  2
Add a month column in D. Type Month in D1, then put this in D2:
Orders: D2
=ARRAYFORMULA(IF(A2:A="", "", TEXT(A2:A, "yyyy-mm")))
Now make a tab called Monthly and put one QUERY in A1:
Monthly: A1
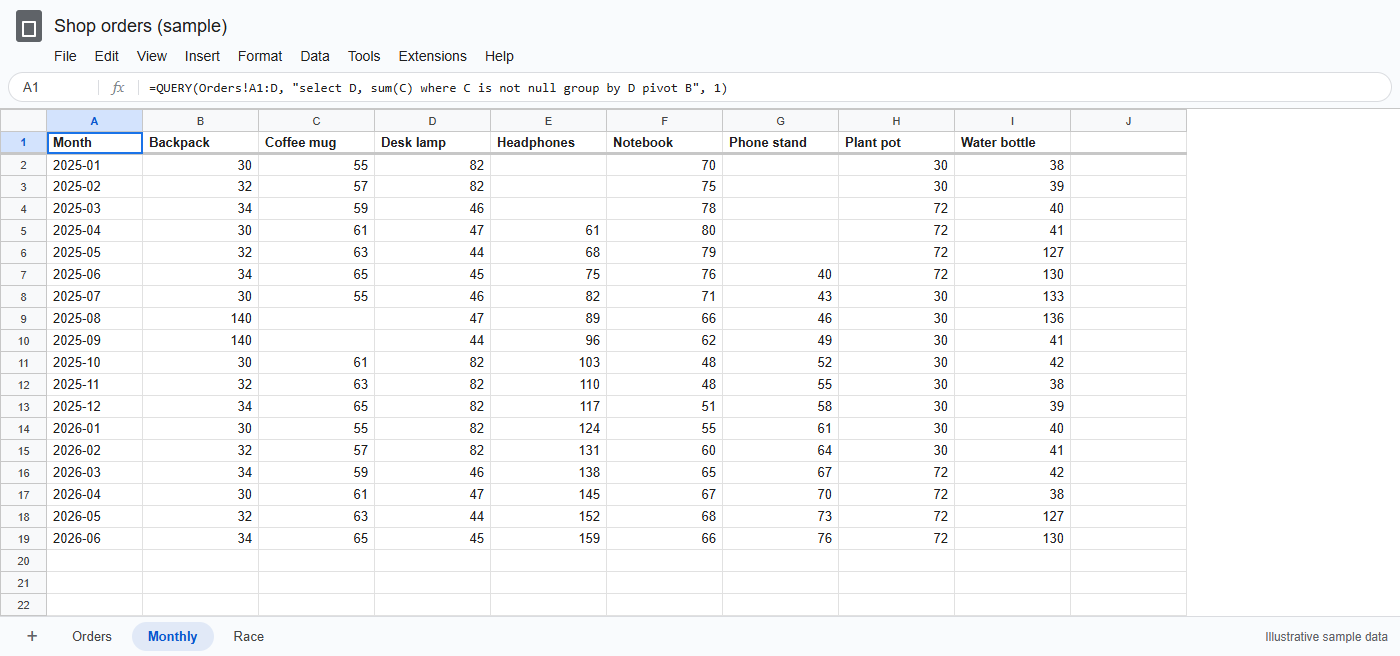
=QUERY(Orders!A1:D, "select D, sum(C) where C is not null group by D pivot B", 1)
group by D gives one row per month, pivot B turns each product into its own column, and sum(C) fills in the units. where C is not null skips the empty rows below your data, so the open-ended range keeps working as the log grows. The final 1 tells QUERY the first row is a header. Months come out in order (that's the text label paying off), and products come out A to Z. If your spreadsheet locale uses commas for decimals, separate the arguments with semicolons instead.
If you prefer menus, a pivot table does the same job. Go to Insert → Pivot table, add Month under Rows, Product under Columns and Units under Values, summarised by SUM. Then untick Show totals for both Rows and Columns. Otherwise "Grand Total" turns up as a bar and wins every frame.
3. How to add running totals and fill the gaps
Look at the blanks. Headphones launched in April, Phone stand in June, and Coffee mug was out of stock in August and September. A blank can mean "hadn't started", "zero" or "unknown", and the chart will treat them all the same unless you decide for it.
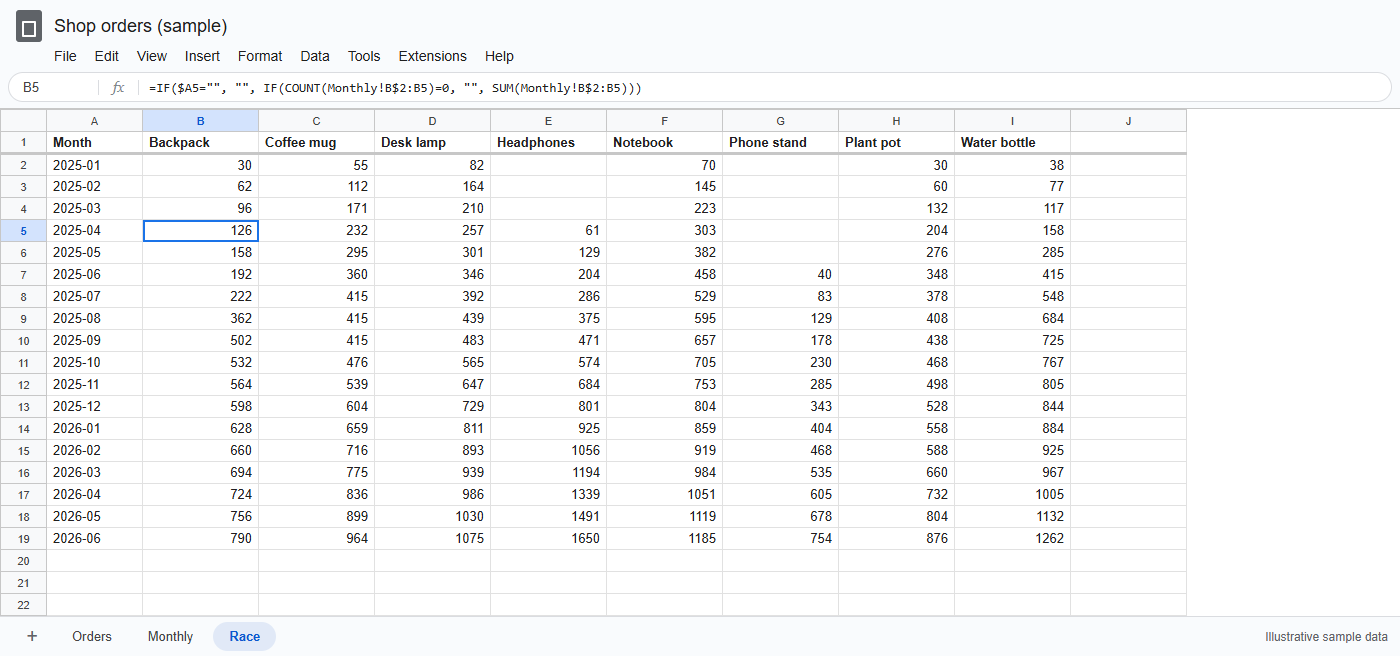
For running totals, make a Race tab. Bring the labels across with ={Monthly!A1:A} in A1 and ={Monthly!B1:I1} in B1. Then put this in B2 and fill it down and right:
Race: B2
=IF($A2="", "", IF(COUNT(Monthly!B$2:B2)=0, "", SUM(Monthly!B$2:B2)))
SUM treats blanks as zero, so the out-of-stock months simply add nothing. The COUNT test leaves a cell empty until the product's first sale, so Headphones enters the race in April instead of sitting at zero from January. The $A2 test returns nothing on rows without a month, which means you can fill the formula well past today and new months fill in by themselves.
If you'd rather have one formula per column, SCAN does the running total (this version shows zeros before launch rather than blanks):
Running total with SCAN
=SCAN(0, Monthly!B2:B19, LAMBDA(total, v, total + N(v)))
Some data isn't a flow but a snapshot: subscribers, headcount, a price. There a blank means "not reported", and the right fix is to carry the last value forward:
Carry the last value forward
=SCAN("", Monthly!B2:B19, LAMBDA(last, v, IF(v="", last, v)))
One more trap. QUERY only returns months that have at least one order, so a month with no orders at all disappears and the steps become uneven. If that can happen, build the month list yourself and use SUMIFS instead of QUERY:
A2
=ARRAYFORMULA(TEXT(DATE(2025, SEQUENCE(18), 1), "yyyy-mm"))
B2
=SUMIFS(Orders!$C:$C, Orders!$D:$D, $A2, Orders!$B:$B, B$1)
DATE rolls month 13 over into January of the next year, so this gives 18 consecutive months, and SUMIFS returns 0 for an empty month.
4. How to publish a Google Sheet as a CSV link
To give other tools a link to the numbers, go to File → Share → Publish to web. Pick the Race sheet rather than Entire document, choose Comma-separated values (.csv) and press Publish. Copy the link it gives you; it ends in output=csv.
Under Published content and settings, "Automatically republish when changes are made" is on by default, so the link keeps serving current values. Google says updates can take a few minutes (Google's help page). Anyone with the link can read what you publish, which is another reason to publish only the summary tab and keep the raw orders private. The CSV carries values as they're displayed, so keep the Race tab in plain number format and add currency symbols in the chart tool.
5. How to turn the sheet into a bar chart race video
You have a few routes: a Python script, a hosted data-visualisation platform, or a browser tool. I'll use chart.video's bar chart race maker, which I work on. It's free, needs no account and adds no watermark.
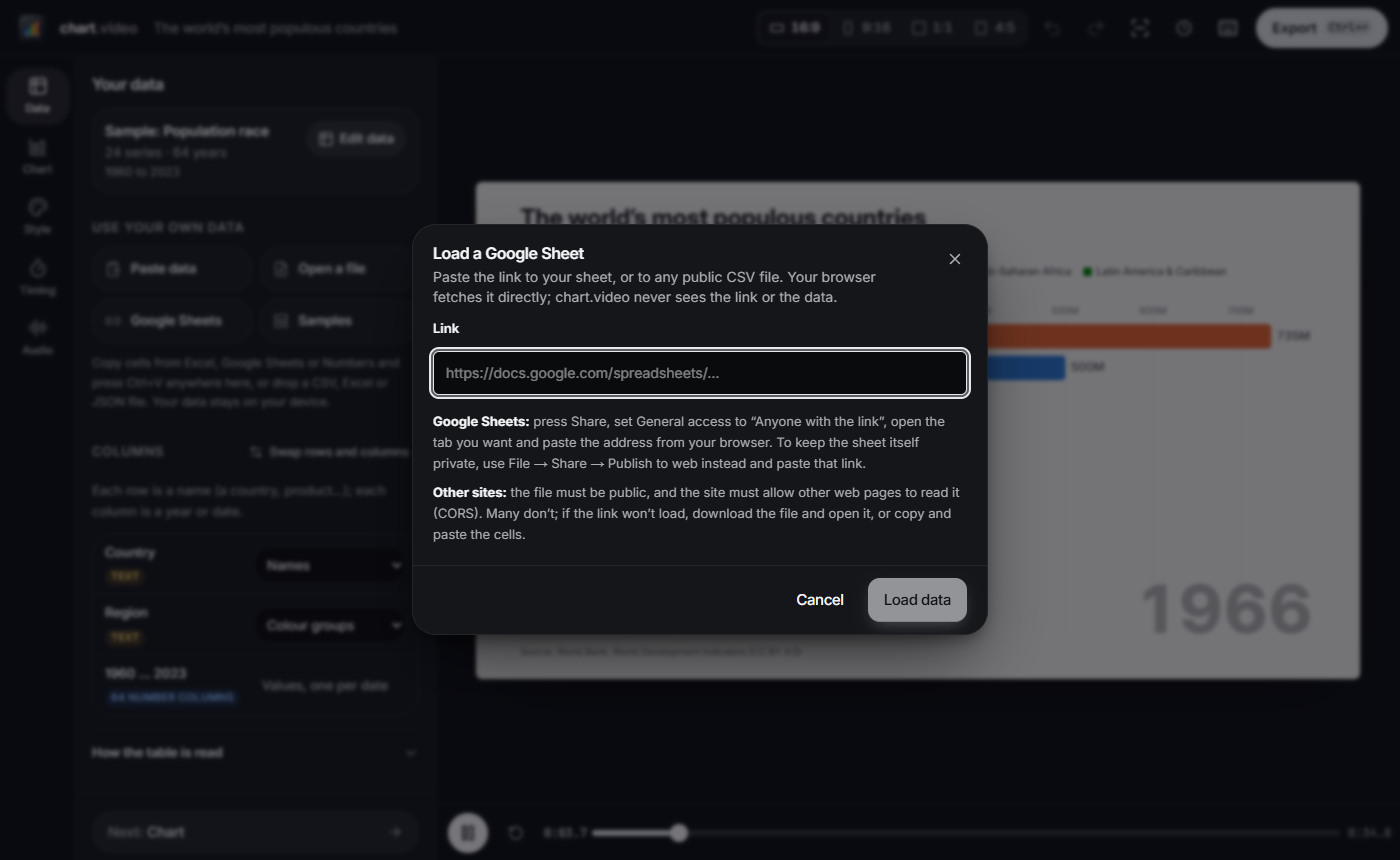
Pick Bar race, then in the Data step press Google Sheets and paste the published link. The normal address of a sheet also works if it's shared with "Anyone with the link". Your browser fetches the data directly. You can also use Paste data to paste copied cells, or Open a file with a CSV from File → Download → Comma-separated values.
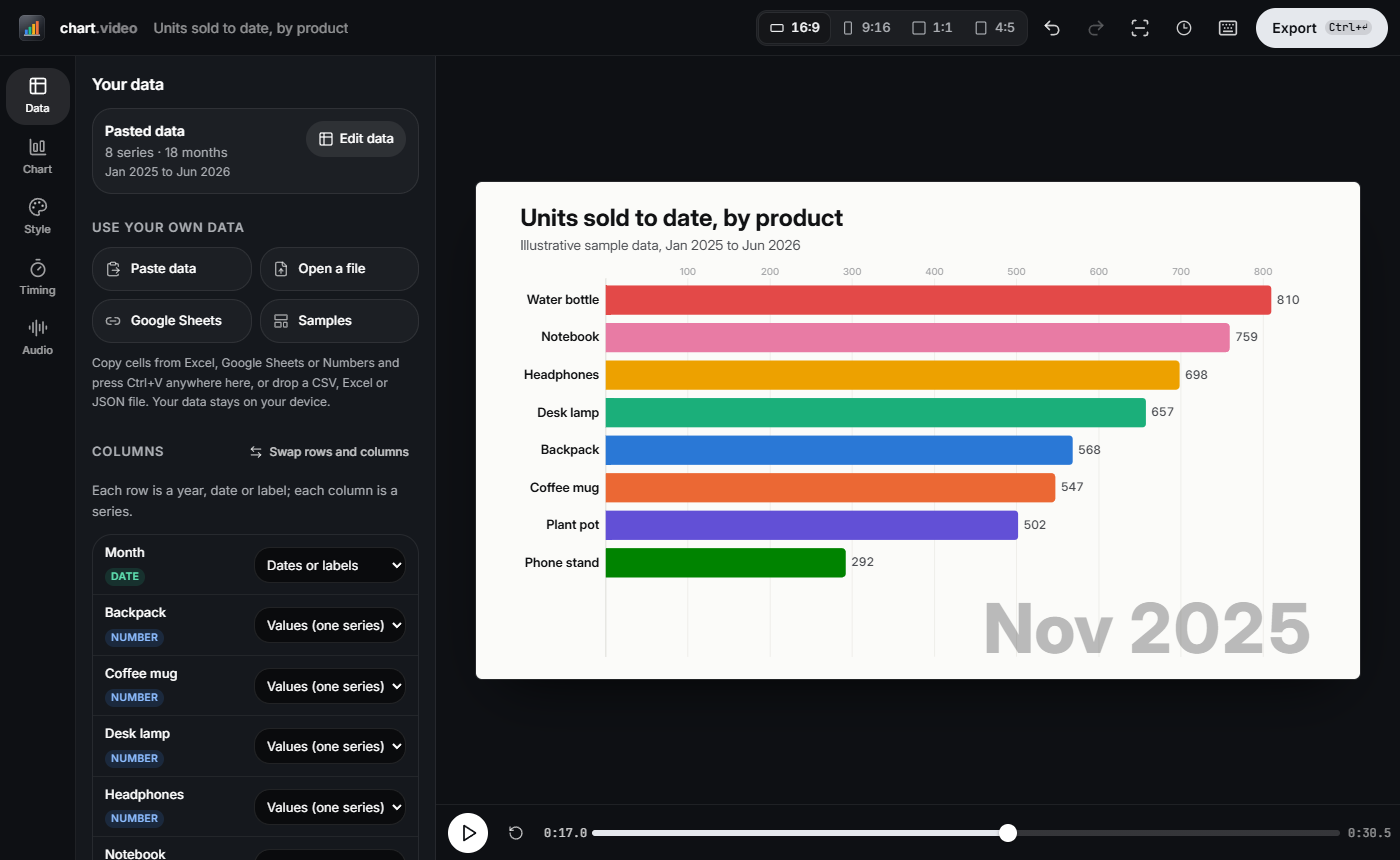
The wide table is read as one row per date and one column per series, and the Month column is detected as dates. If it guesses wrong, the layout can be changed under How the table is read. One honest caveat: the link is read when you load it. It doesn't watch the sheet. When the numbers change, press Refresh from sheet and export again. As long as the columns haven't changed, your title, colours and timing stay as you set them.
Five things that make a bar chart race look good
Sorting. The bars re-sort by value on every frame (Keep sorted by value, on by default), so the row order of your sheet doesn't decide the ranking. Column order still matters for ties.
Ties. When two values are exactly equal, the column that comes first in the table stays on top. After a QUERY pivot that means alphabetical order. If you care who wins a tie, reorder the columns, or race a finer measure such as revenue so exact ties are rare.
Labels. Column headers become bar labels, so keep them short: "Phone stand", not "SKU 4471 Phone stand (black)". The month shows large in the corner of the chart. Add a Title, Subtitle and Source in Style.
Duration and frame rate. These are separate settings. Duration comes from Time per year, month or step in Timing (or set a Total length). Somewhere between half a second and a second and a half per step is readable; much faster and overtakes blur. Frame rate is chosen at export, 30 or 60 fps. 60 makes fast overtakes look smoother but doesn't change the length.
Number of bars. Bars shown runs from 3 to 20, and items outside the top slide in as they climb. Eight to twelve works for a 16:9 video. For a vertical 9:16 clip viewed on a phone, use fewer.
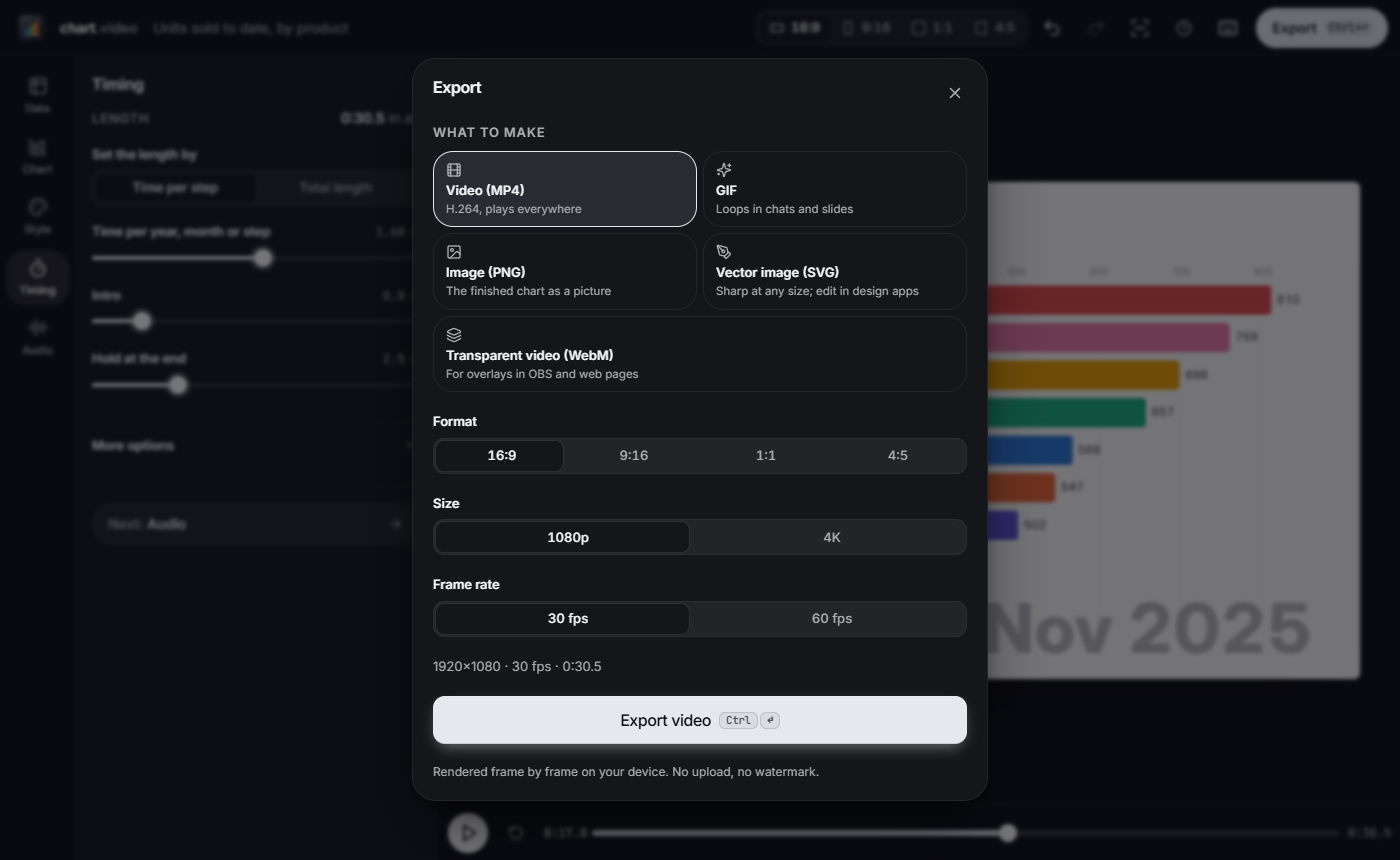
Export as Video (MP4), or choose GIF for slides and chat, in 16:9, 9:16, 1:1 or 4:5. After that, a monthly update means adding orders, waiting a few minutes for the CSV to republish, pressing Refresh from sheet and exporting again.
FAQ
Can Google Sheets make a bar chart race by itself?
No. Sheets has standard bar and column charts, but no animated chart type and no video export. Use Sheets to prepare the data, then animate it in another tool.
What's the difference between a bar chart race and an animated bar chart?
In a race, the bars re-sort as their values change, so they overtake each other. In a plain animated bar chart, the bars grow and stay in the same order.
Should I use running totals or monthly values?
Running totals for most races, because the bars only climb and each overtake is a real change in the lead. Use monthly values if the ups and downs are the story, and carry the last value forward for snapshots such as subscribers.
How long should a bar chart race be?
Between half a second and a second and a half per step is readable. An 18-month table runs for about 10 to 30 seconds at that pace.
Will the video update when my sheet changes?
The published CSV link stays current, but a video is a fixed file. When the numbers change, refresh the data and export a new one.
Can I make one without code?
Yes. Everything above uses spreadsheet formulas and a browser. Python's bar_chart_race library is an option if you'd rather script it.
Got a sheet with dates and a few things worth comparing? Build the Race tab, load it in, and watch which line of your spreadsheet wins.
About the author
Jane Clark
Jane Clark works on chart.video.
This is a guest post. Read about guest posts on Better Sheets.
