Box office tells you who won the weekend. I wanted to know something else: which of this fall’s movies people kept looking up after the opening rush was over.
Wikipedia is a decent proxy for that. When someone sees a trailer, hears about a movie at work, or finishes watching it and wants to know who that actor was, a lot of them end up on the movie’s Wikipedia page. Wikimedia publishes how many people read every page, every day. So I pulled those numbers into my Wikipedia Trends Tracker sheet for nine movies that came out in the US in September 2026 and lined them up by days since release.
The setup
Nine movies, all wide or big streaming releases between September 4 and September 25:
- Mayday, Onslaught, By Any Means (Sept 4)
- Practical Magic 2, The Uprising (Sept 10)
- Runner (Sept 11)
- Resident Evil (Sept 18)
- Heart of the Beast, Forgotten Island (Sept 25)
Each movie gets a column with three inputs: its name, its Wikipedia page name (the part after /wiki/ in the URL), and its US release date.

How the sheet does it
The Trend Tracker has a custom function called getPageViews. You hand it a Wikimedia pageviews API URL and it returns the view count. The COMPARE tabs in the template use it month by month, which is great for “is this topic growing or shrinking this year” but too coarse for movies, where everything happens in the first two weeks.
So I pointed it at the daily API instead, one cell per day. Column A counts days since release (0 to 20). Each cell builds a URL from the page name and the release date plus that many days:
=IF(B$3+$A5>DATE(2026,10,12),"",
  getPageViews("https://wikimedia.org/api/rest_v1/metrics/pageviews/per-article/en.wikipedia/all-access/all-agents/"
  &B$2&"/daily/"&TEXT(B$3+$A5,"yyyymmdd")&"/"&TEXT(B$3+$A5,"yyyymmdd")))
The IF leaves a cell blank if that day hasn’t happened yet (I ran this on October 13, so October 12 is the last full day). One formula, pasted across 9 columns and 21 rows. That’s the whole thing.
Lining every movie up by “days after release” instead of by calendar date is what makes them comparable. A Sept 4 movie and a Sept 25 movie both start at day 0.
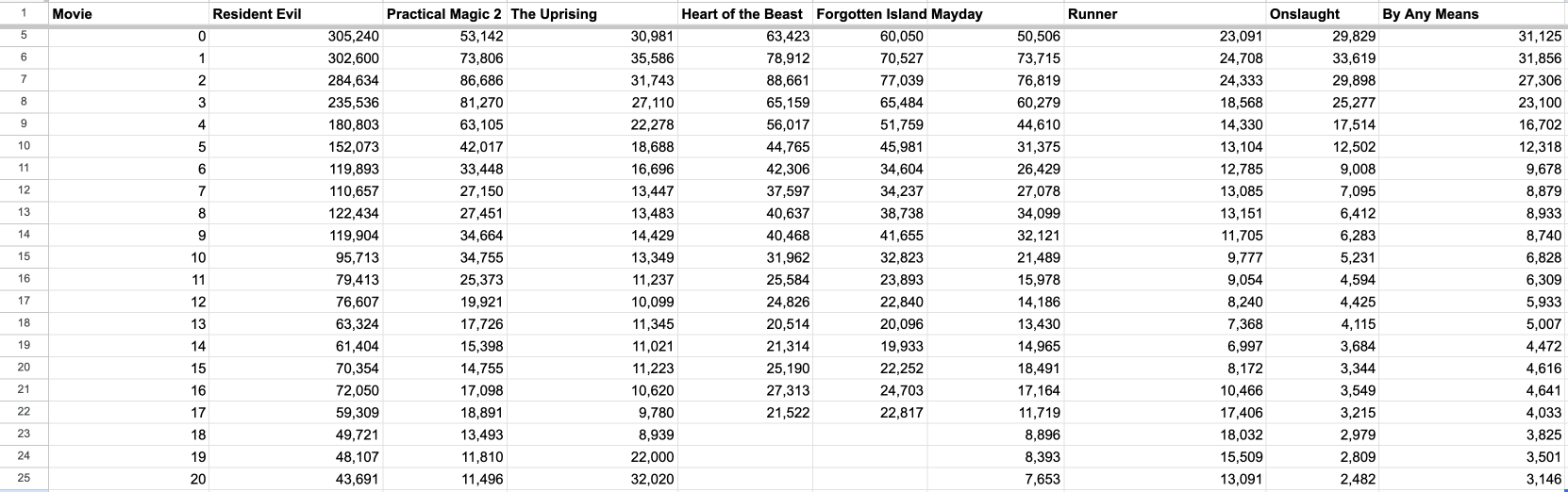
Under the grid I added a few totals: week 1 (days 0 to 6), week 2 (days 7 to 13), week 2 as a percent of week 1, and views on October 12.
What the sheet found
Resident Evil was in its own league
Resident Evil had 1,580,779 views in its first week. That’s more than the next three biggest openers combined (Heart of the Beast 439,243, Practical Magic 2 433,474, Forgotten Island 405,444).
Its opening day alone was 305,240 views. And on October 12, 24 days after release, it still pulled 51,553 views. That’s more than the opening day of five of the other eight movies.
But big openings dropped about the same as everything else
Here’s the table sorted by how much of week 1’s attention survived into week 2.
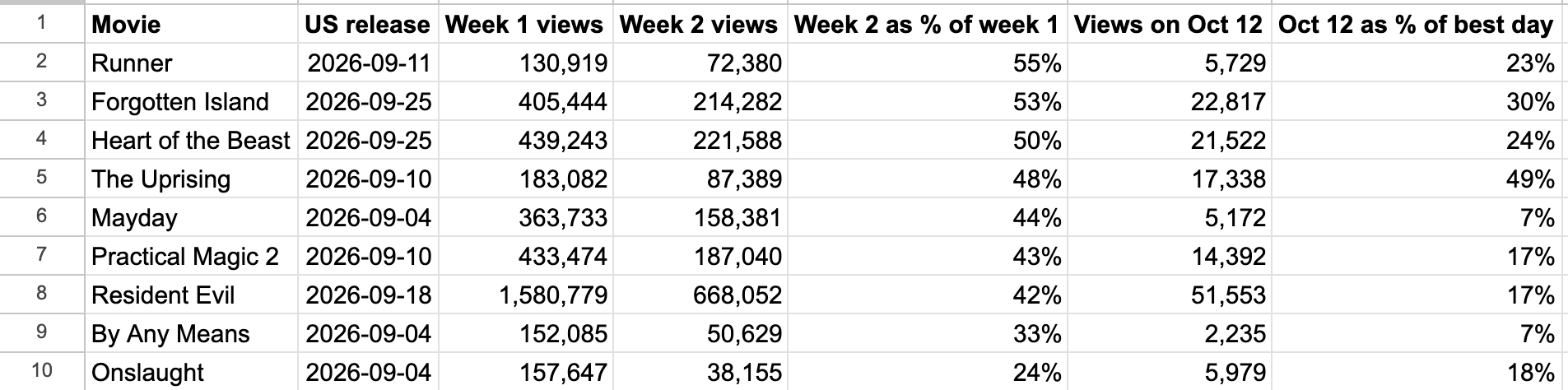
Most of these land between 42% and 55%. Resident Evil kept 42%, Practical Magic 2 43%, Mayday 44%. Size didn’t buy a better hold.
The top of the list is Runner at 55%. It had the smallest first week of the nine (130,919), but it lost the least. It also opened 4th at the box office and got an A- CinemaScore, so it lines up with people telling friends about it.
The bottom is Onslaught at 24% and By Any Means at 33%. Onslaught started with 33,619 views on day 1 and was under 5,000 a day by day 11.
The Uprising is the one that didn’t fade
This is the part I didn’t expect. Sort by how much of each movie’s best day it still had on October 12:
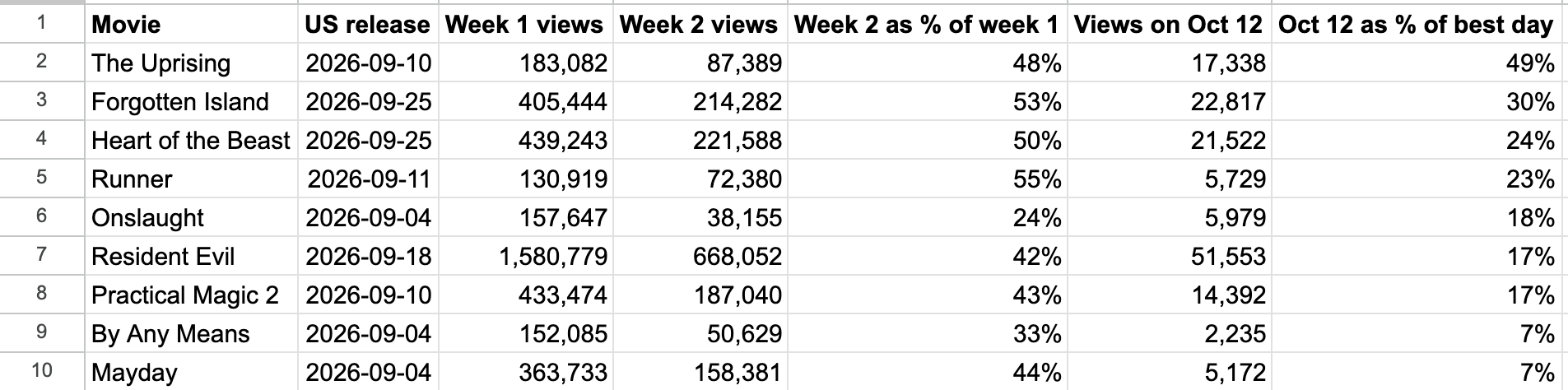
The Uprising is still at 49% of its best day. Next is Forgotten Island at 30%. (Forgotten Island and Heart of the Beast look good here partly because they came out on Sept 25, so they’ve only had 17 days to fade. The Uprising has had 32.)
The Uprising and Practical Magic 2 came out on the same day, September 10, so I charted just those two side by side for every day through October 12.
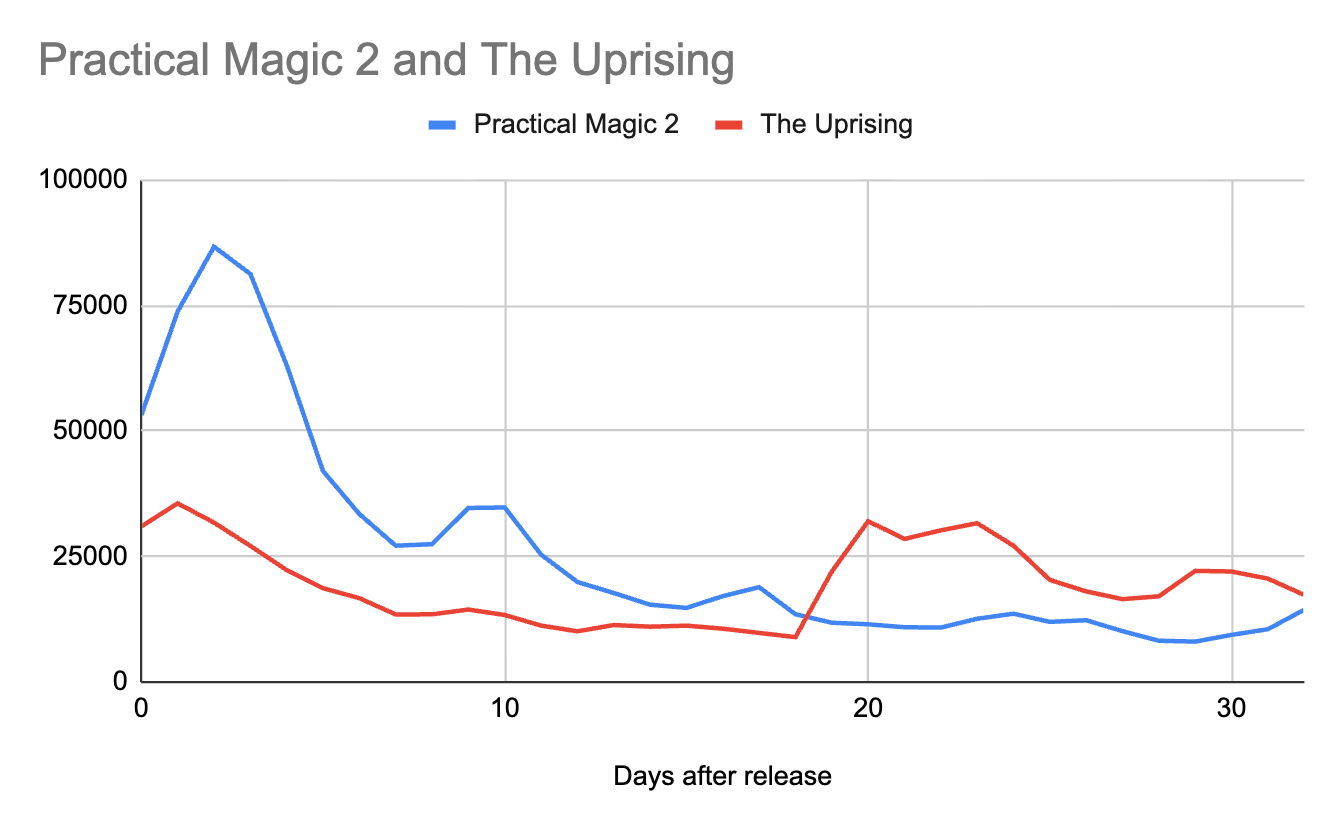
Practical Magic 2 opened way bigger. It peaked at 86,686 views on day 2, while The Uprising never got above 35,586 in its first week. By day 18 The Uprising was down to 8,939 a day and looked done.
Then on day 19 (September 29) it jumped to 22,000, and to 32,020 the next day. It has been ahead of Practical Magic 2 every single day since. From September 29 to October 12, The Uprising had 325,488 views. Practical Magic 2 had 156,216.
The sheet can’t tell me why. The film’s Wikipedia page doesn’t mention anything happening around September 29, and its UK release wasn’t until October 9. Something sent people back to that page, and whatever it was is still going two weeks later.
Runner had a smaller version of the same thing. It jumped from 6,997 views on day 14 to 18,032 on day 18, which is why its week 3 came in at 68% of its week 1.
Total views still went to the big openers
Over the full 33 days from Sept 10 to Oct 12, Practical Magic 2 had 856,365 views and The Uprising had 647,542. So if the question is “which movie got more attention,” it’s still Practical Magic 2. If the question is “which one is people still looking up,” right now it’s The Uprising, by a lot.
A few notes if you try this
- Use the exact page name. “Resident_Evil” is the 2002 movie. The 2026 one is “Resident_Evil_(2026_film)”.
-
getPageViewsreturns the first number in whatever range you give it, so give it one day at a time (same start and end date), not a week. - These are all-agents numbers, which is the template’s default. They include some bot traffic. For comparing movies against each other that’s fine, since they all get it.
- Use the US release date, not the premiere. Practical Magic 2 premiered in London on August 26, but most of its readers showed up after September 10.
Get the sheet
The Wikipedia Trends Tracker is free. Make a copy, paste in some Wikipedia pages, and the COMPARE tabs chart them month by month. For day-by-day stuff like this, add a tab and use the formula above.
